Gold Price (XAU/USD) Drops to $2,330s; What to Expect in the Week Ahead?
The gold price (XAU/USD) retreated to the $2,330s, reversing the gains made after the release of US Personal Consumption Expenditure (PCE) data for April.

The PCE, the Federal Reserve’s preferred inflation gauge, showed core price pressures cooling to 0.2% month-over-month, down from 0.3%, according to the Bureau of Economic Analysis. Analysts had anticipated Core PCE to remain steady at 0.3%.
While the broader PCE data aligned with expectations, the unexpected drop in Core PCE indicated that inflation in the US is cooling faster than predicted. This scenario has heightened the probability of the Federal Reserve cutting interest rates sooner rather than later.
Lower interest rates generally favour gold by reducing the opportunity cost of holding the non-yielding asset, which explains the precious metal’s rise post-data release.
Impact of US Growth Data on Gold Prices
Gold experienced a recovery starting Thursday, following the release of weaker US growth data. The second estimate of US first-quarter GDP growth was revised down to an annualized 1.3% from the initial estimate of 1.6%.
The slower growth stemmed from reduced consumer spending, which is expected to keep inflation in check and the Federal Reserve on course to lower interest rates.
Consequently, the yield on the US 10-year Treasury Note dropped to 4.55% from a four-week high of 4.63%. Despite these developments, gold prices began to pull back as the weekend approached, with potential to end the day in negative territory.
According to the CME FedWatch Tool, the chances of the Fed cutting interest rates before September are low, but the probability stands at 55% for a rate cut in September.
Asian Demand for Gold as a Currency Hedge
US interest rate expectations are not the sole factor influencing the gold price. According to Daniel Ghali, a Senior Commodity Strategist at TD Securities, gold demand is also driven by Asian buyers using the metal as a hedge against their depreciating currencies relative to a strengthening US Dollar (USD).
“Precious metals are acting as a currency depreciation hedge. Case in point: fund flows into Chinese gold ETFs are rising once more at their fastest pace since the massive buying activity observed in April. US yields are surging, the dollar broke out of its lull, and yet precious metals prices have remained extremely resilient,” Ghali notes.
This trend suggests that the strength of the US Dollar may not negatively impact gold prices as much as it has historically. Consequently, gold prices could remain resilient even if the USD appreciates.
Economic Events Next Week
The upcoming week features several key economic events that could significantly impact the price of gold:
Monday, June 3:
- 13:45 USD Final Manufacturing PMI (Forecast: 50.9, Previous: 50.9)
- 14:00 USD ISM Manufacturing PMI (Forecast: 49.8, Previous: 49.2)
- USD ISM Manufacturing Prices (Forecast: 60.0, Previous: 60.9)
Tuesday, June 4:
- 14:00 USD JOLTS Job Openings (Forecast: 8.40M, Previous: 8.49M)
Wednesday, June 5:
- 12:15 USD ADP Non-Farm Employment Change (Forecast: 175K, Previous: 192K)
- 13:45 USD Final Services PMI (Forecast: 54.8, Previous: 54.8)
- 14:00 USD ISM Services PMI (Forecast: 51.0, Previous: 49.4)
Thursday, June 6:
- 12:30 USD Unemployment Claims (Forecast: 215K, Previous: 219K)
Friday, June 7:
- 12:30 USD Average Hourly Earnings m/m (Forecast: 0.3%, Previous: 0.2%)
- USD Non-Farm Employment Change (Forecast: 185K, Previous: 175K)
- USD Unemployment Rate (Forecast: 3.9%, Previous: 3.9%)
Gold Price Forecast;
Gold spot prices closed trading around $2,327.60, slightly below the pivot point at $2,352.75. The immediate resistance level stands at $2,350.36, followed by $2,366.51 and $2,379.32.
On the support side, the immediate level is $2,324.79, with further support at $2,307.40 and $2,291.54.
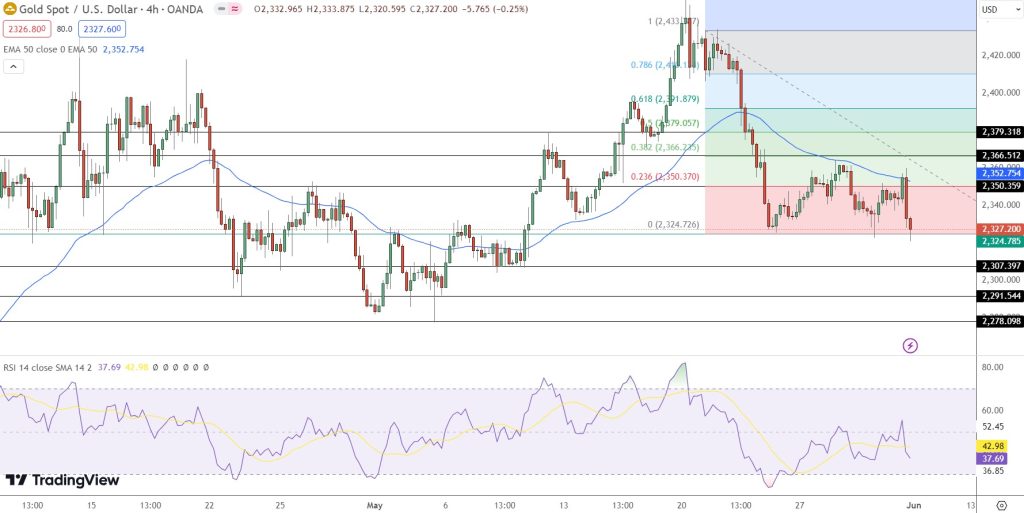
The Relative Strength Index (RSI) at 37.69 indicates oversold conditions, suggesting a potential rebound.
However, the current price is below the 50-day Exponential Moving Average (EMA) of $2,352.75, pointing to a bearish sentiment in the market. As gold navigates these critical levels, traders should monitor these support and resistance points closely.


Sidebar rates
Related Posts
