FTSE: UK Stock Index Sets off the Week with a Flying Start – Second Vote in MPC Meeting & GDP Data.

Last week’s MPC meeting saw the number of votes in favour of a rate cut increase from one to two, increasing hopes for a sooner rather than later change to a dovish monetary policy.
Last Friday we also saw GDP rise from -0.2% to 0.2% YoY, officially bringing the UK out of recession. The FTSE continued to climb still powered by hopes of lower interest rates. The index managed a day high of 8447, just short of Friday’s all-time-high at 8456, before retreating.
| Broker | Review | Regulators | Min Deposit | Website | |
|---|---|---|---|---|---|
| 🥇 |  | Read Review | FCA, CySEC, ASIC, MAS, FSA, EFSA, DFSA, CFTC | USD 100 | Visit Broker |
| 🥈 | Read Review | FSCA, FSC, ASIC, CySEC, DFSA | USD 5 | Visit Broker | |
| 🥉 |  | Read Review | CySEC, MISA, FSCA | USD 25 | Visit Broker |
| 4 |  | Read Review | ASIC, BaFin, CMA, CySEC, DFSA, FCA, SCB | USD 200 | Visit Broker |
| 5 |  | Read Review | ASIC, FCA, CySEC, SCB | USD 100 | Visit Broker |
| 6 | Read Review | FCA, FSCA, FSC, CMA | USD 200 | Visit Broker | |
| 7 | Read Review | BVI FSC | USD 1 | Visit Broker | |
| 8 |  | Read Review | CBCS, CySEC, FCA, FSA, FSC, FSCA, CMA | USD 10 | Visit Broker |
| 9 |  | Read Review | ASIC, CySEC, FSCA, CMA | USD 100 | Visit Broker |
| 10 |  | Read Review | IFSC, FSCA, ASIC, CySEC | USD 1 | Visit Broker |
The concerns that are afflicting the DAX index regarding interest rates and trade wars are not taking hold of the FTSE. Even though the BoE may be susceptible to the Fed’s monetary policy it has a much more independent stance as it has demonstrated in the past many times.
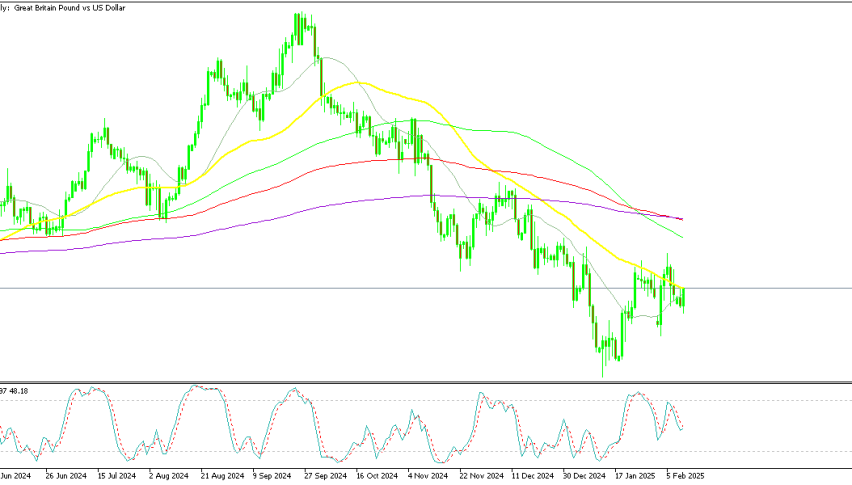
So, stock investors are looking more at domestic economic growth and the looming possibility of a rate cut by July. US inflation data may have some impact on Wednesday, but I would expect it to be short lived.
Technical View
The day chart below for the FTSE shows a very bullish trend that broke out in March, after trading sideways for the first months of 2024. The current price level is in overbought territory at 80.8, but also shows the strength of this rally.
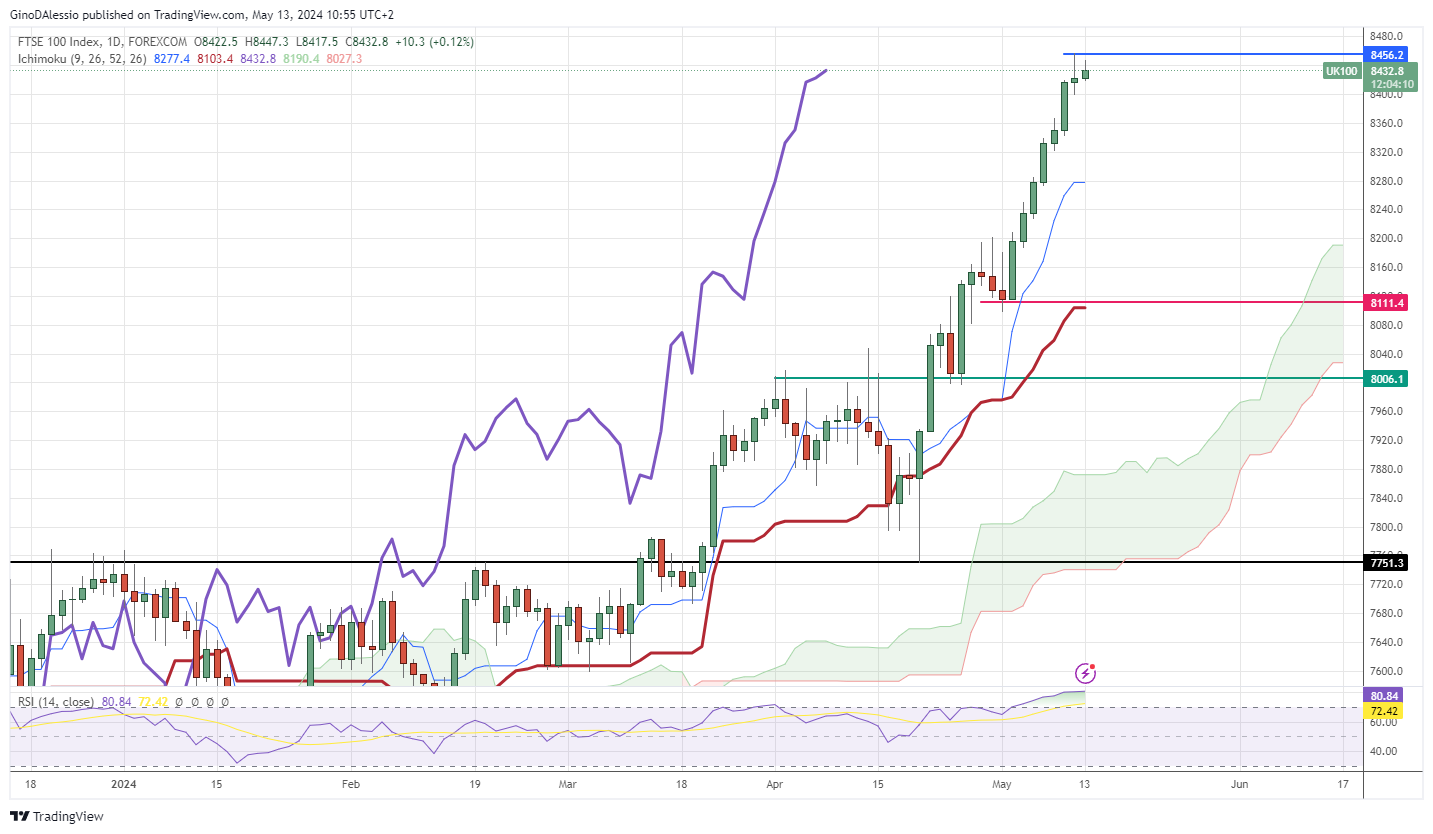
The market has produced seven successive all-time highs in a row. A remarkable feat for any market, so after 7 consecutive green candles you might expect a correction. A typical signal of a correction comes from the RSI crossing below 70.
If it were to materialise the next support would be the 0.236 number of the Fibonacci retracement tool at 8288. If that were to break, further support would be found at 8186 the 0.382 number of the Fibonacci system.

Add 3442

Related Posts
Add 3440