Bitcoin Drops 16%: Weakness Because Of United States Economy?
Bitcoin prices continue to trickle lower at press time, posting losses over the weekend. With bears having the upper hand and the drawdown spilling over, the probability of the coin dipping below $60,000 is elevated at press time. Technically, the sell-off is a continuation of weakness from last week. As it is, Bitcoin risks dumping, confirming losses from two weeks ago, and essentially breaking out from the existing range.
Bitcoin is down 3% in the past 24 hours at press time, and 6% in the previous trading week. Even though buyers have a chance, there must be a sharp bounce from spot rates. Falling prices also means trader interest has waned, looking at the average trading volume in the past 24 hours. At around $21 billion, it might be up 20% but is generally lower than averages. The spike in trading volume at the back of expanding dropping prices could mean sellers are pressing and looking for exits.

| Broker | Review | Regulators | Min Deposit | Website | |
|---|---|---|---|---|---|
| 🥇 |  | Read Review | FCA, CySEC, ASIC, MAS, FSA, EFSA, DFSA, CFTC | USD 100 | Visit Broker |
| 🥈 | Read Review | FSCA, FSC, ASIC, CySEC, DFSA | USD 5 | Visit Broker | |
| 🥉 |  | Read Review | CySEC, MISA, FSCA | USD 25 | Visit Broker |
| 4 |  | Read Review | ASIC, BaFin, CMA, CySEC, DFSA, FCA, SCB | USD 200 | Visit Broker |
| 5 |  | Read Review | ASIC, FCA, CySEC, SCB | USD 100 | Visit Broker |
| 6 | Read Review | FCA, FSCA, FSC, CMA | USD 200 | Visit Broker | |
| 7 | Read Review | BVI FSC | USD 1 | Visit Broker | |
| 8 |  | Read Review | CBCS, CySEC, FCA, FSA, FSC, FSCA, CMA | USD 10 | Visit Broker |
| 9 |  | Read Review | ASIC, CySEC, FSCA, CMA | USD 100 | Visit Broker |
| 10 |  | Read Review | IFSC, FSCA, ASIC, CySEC | USD 1 | Visit Broker |
The following Bitcoin news events might influence price action:
- There are fears of stagflation in the United States, a development that could negatively impact the allocation of funds into traditionally “risky” assets like BTC. Last week, GDP slowed down at an unexpected pace amid rising inflation.
- Wasabi Wallet developers zkSNACKS have blocked United States citizens from using their tool. Last week, leading developers of the privacy-focused wallet were arrested. They are likely to be prosecuted, facing charges similar to those of Tornado Cash developers.
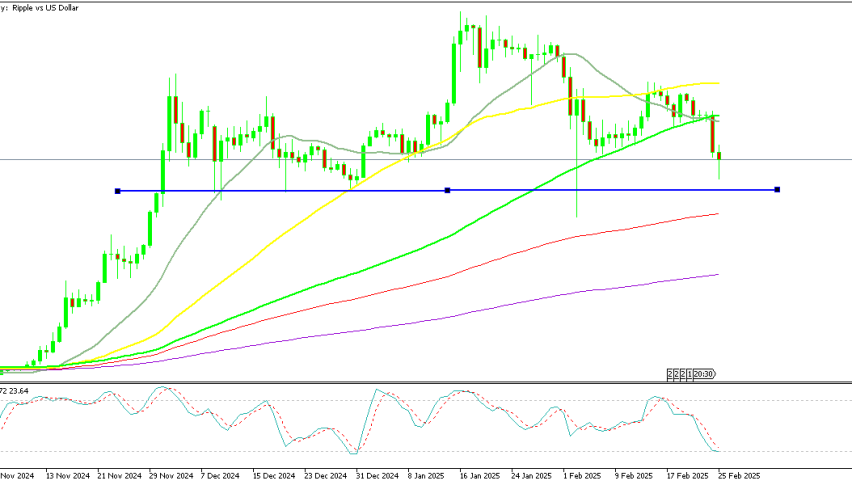
Bitcoin Price Analysis
BTC/USD is under immense selling pressure, down roughly 16% from all-time highs.
The coin continues to slip, even after the highly anticipated Halving event.
From the Bitcoin daily chart, the zone between $60,000 and $61,000 represents a key support level.
On the upper end, the coin has liquidation at $68,000.
For a defined trend, either price must cross $68,000 or dump below $60,000.
Before then, risk-on traders should closely monitor price action.
Any dump below $60,000 will likely see BTC slip to $53,000 in a bear trend continuation formation.

Sidebar rates
Add 3442

Related Posts
Add 3440