XAU/USD: Gold Retreats from Latest All-Time-High – US Economic News Cools the Rally
Gold retreated from the ATH reached earlier on today after US data showed an uptick in the rate of inflation.


Gold retreated from the ATH reached earlier on today after US data showed an uptick in the rate of inflation.
The increase in inflation was only slightly higher than expected at 3.5% instead of the 3.4% forecast. However, it reflected a larger increase over last month’s number of 3.2%. Worse yet, it indicates that inflation may be around for longer and at higher than expected levels.
The Federal Reserve has repeatedly indicated that they’re ready for rate cuts. But at the same time, they’ve also stated they’re keeping a vigilant eye on inflation. Meaning interest rates could stay higher for longer considering today’s inflation data.
So, bond yields have risen sharply today, with 2-year Treasury yields up 30 basis points (or 4.86%) and 10-year Treasury yields are up 21 basis points (or 4.26%) on the day. Both yields reached levels not seen since November 2023.
The initial reaction for XAU/USD when interest rates rise is to decrease in price. Due mainly to bonds being more attractive as gold has no income streams. Another factor weighing on gold prices will be the US dollar FX rate.
The DXY rose 1.13% today on the back of bullish inflation data. Major gold exporting countries like Australia and Canada are seeing their currencies devalued. Eventually, this means gold exporters are willing to receive a lower US dollar price for their gold as the exchange rates will give them a higher amount in the local currency.
Technical View
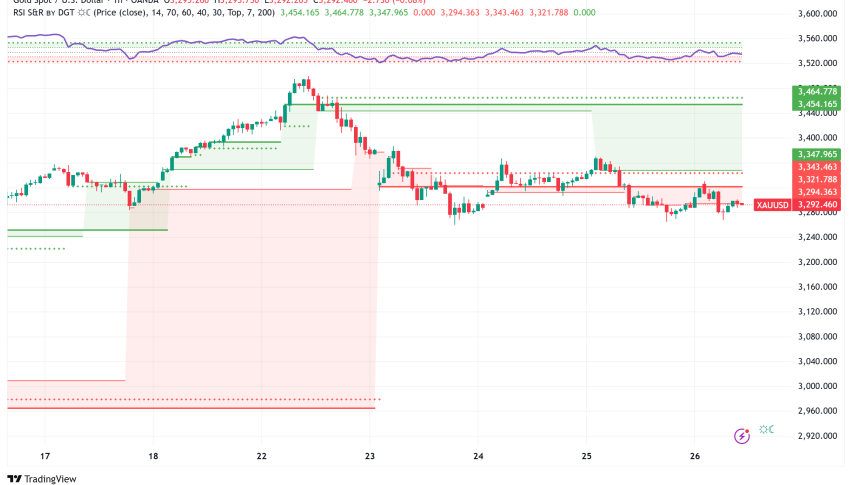
The day chart below for XAU/USD shows a strong bullish trend, with prices well above the Ichimoku cloud. We also see a strong breakout from the resistance level (black line) that the market created in March.

However, the last two candles may be about to close forming a double top. If today’s candle were to close higher we may get a hanging man or a Doji star. In either case, they would be excellent set ups for retracement to lower levels.
The market already tested the closest support at $2,138 (red line), a break to the downside could see the market test the next support level at $2,303 (orange line).
The RSI is also in extremely oversold territory and has been there for some time. We would need the RSI to close below 70 to signal a correction, but the longer it stay above 70 the more likely there is a downside event.
- Check out our free forex signals
- Follow the top economic events on FX Leaders economic calendar
- Trade better, discover more Forex Trading Strategies
- Open a FREE Trading Account


