GBP/USD Stalls at $1.264 Amid BoE Rate Cut Fears and US Dollar Strength
The GBP/USD pair has been on a downward trajectory, hovering around the 1.2616 mark, primarily due to growing expectations of an imminent
The GBP/USD pair has been on a downward trajectory, hovering around the 1.2616 mark, primarily due to growing expectations of an imminent rate cut by the Bank of England (BoE). Market sentiment is tilting towards a potential rate reduction by the BoE, possibly in its June session, driven by the UK’s weakening inflationary pressures.
Concurrently, recent UK economic reports suggest a deceleration in the employment sector, further pressuring the Pound. Anticipation of a BoE rate decrease has exerted a downward force on the Pound, especially with UK inflation cooling, bolstering the case for easier monetary policy.
A decision by the BoE to cut rates might lead to a further decline in the Pound as the market anticipates a more accommodative policy, perpetuating the bearish momentum for the GBP/USD pair.
UK employment data, including slower growth in starting pay and a dip in temporary worker spending, as reported by the UK’s Recruitment and Employment Confederation and the Average Earnings Index, indicate a cooling job market, adding to the Pound’s woes.
Conversely, diminished expectations for a Federal Reserve rate cut in June have lent support to the US Dollar. Contrary to earlier projections of rate cuts, strong US economic indicators, particularly in the job market, have cast doubts on the need for immediate rate reductions.
The solid US employment figures, showcasing strong labour demand and exceeding payroll estimates, have tempered the likelihood of Fed rate cuts, thus strengthening the US Dollar and contributing to the GBP/USD pair’s decline.
GBP/USD Price Forecast: Technical Outlook
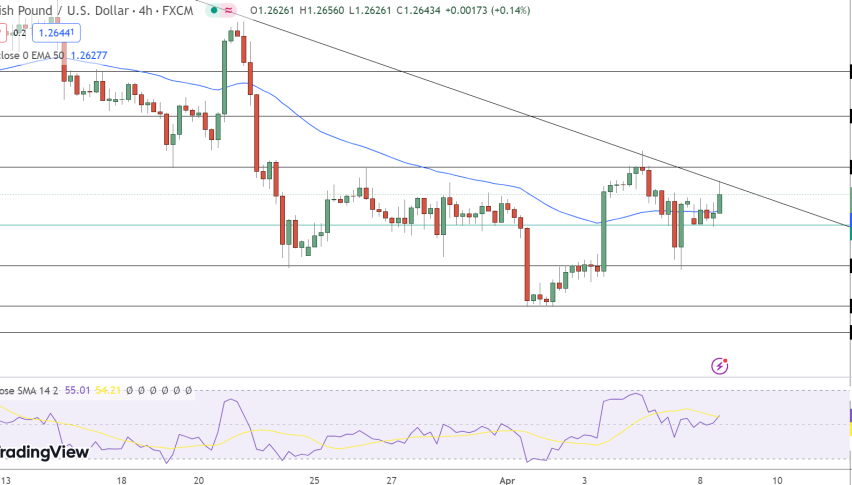
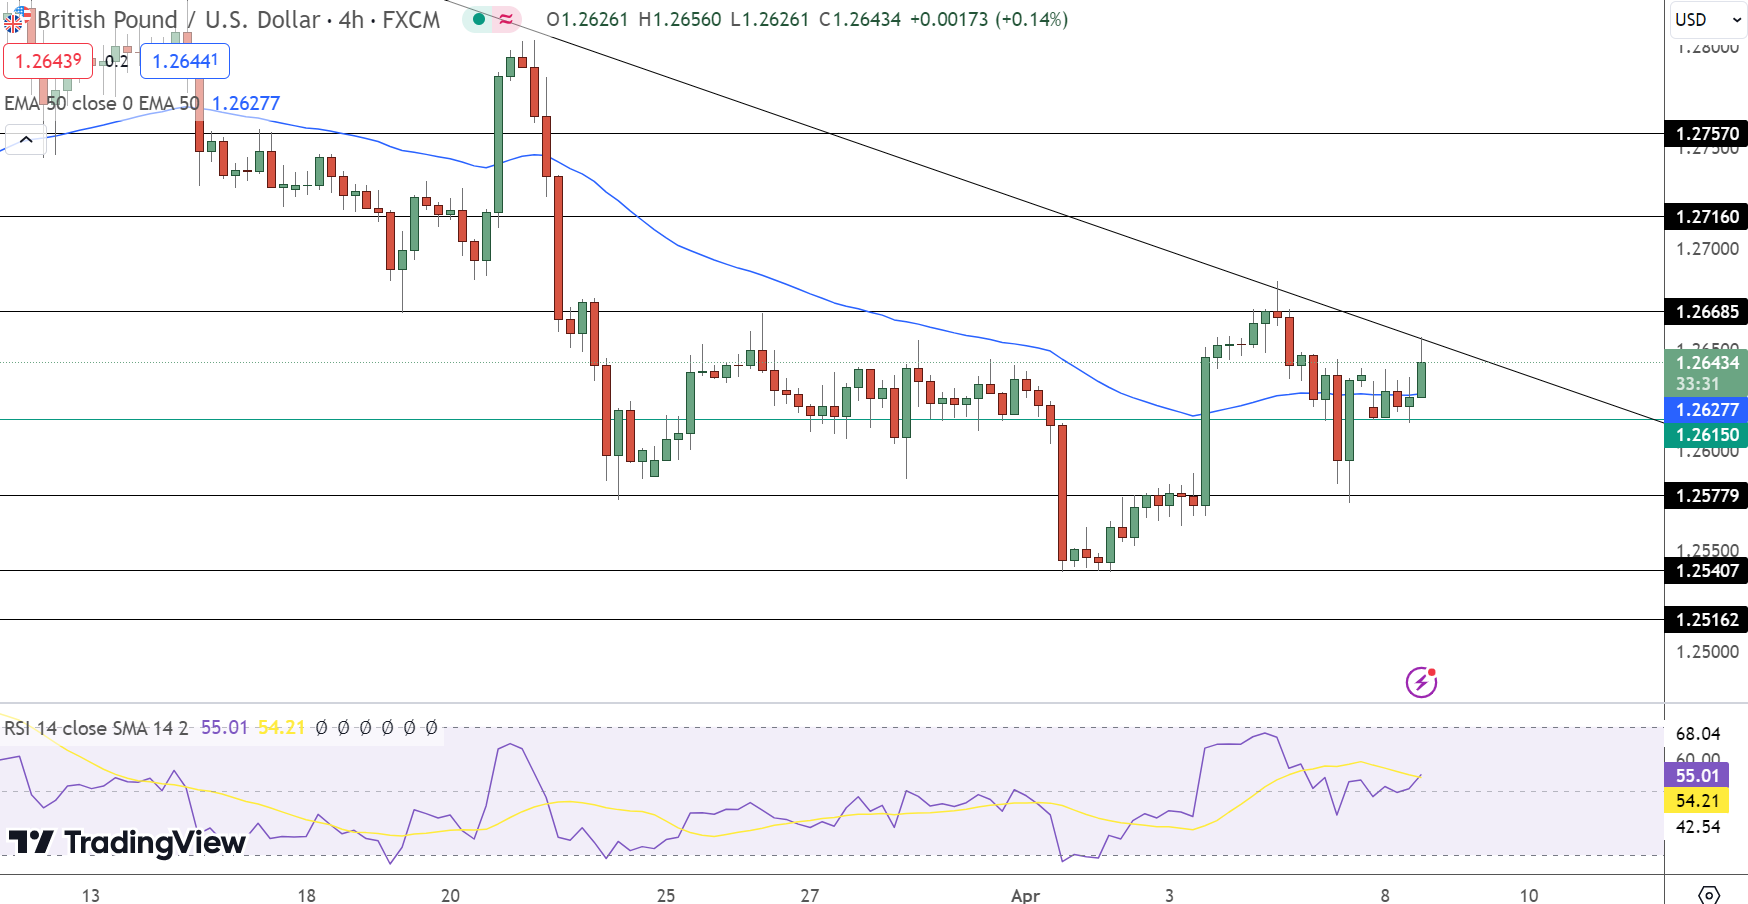
On April 8, the GBP/USD pair showed a modest increase, trading at $1.26434, up by 0.04%. The critical pivot point is at $1.2615, with the pair presenting a bullish stance above this level. Resistance is observed at $1.2669, $1.2716, and $1.2757, while support levels are set at $1.2578, $1.2541, and $1.2516.
The Relative Strength Index (RSI) is at 55, indicating a neutral to slightly bullish market sentiment. The 50-day Exponential Moving Average (EMA) stands at $1.2628, aligning closely with current price levels, and reinforcing the bullish trend.
A breach below $1.2615 could, however, trigger a significant sell-off, emphasizing the importance of this pivot in the market’s direction.
- Check out our free forex signals
- Follow the top economic events on FX Leaders economic calendar
- Trade better, discover more Forex Trading Strategies
- Open a FREE Trading Account
Related Articles

Comments
Sidebar rates
Related Posts
