


WTI Crude Oil Nears $85 Amid Asian Market Surge and OPEC+ Speculations
Asian Market Dynamics: Chinese equities surged, with mainland blue chips up 1.63%, following a report of manufacturing activity hitting a 13-month peak. This contrasts with Japan’s Nikkei, which fell 1.5%, amid yen intervention fears and a new fiscal year start.
U.S. Inflation and Rate Cut Prospects
U.S. S&P 500 futures rose by 0.33% as easing inflation, indicated by a drop in the Fed’s preferred measure, fuels expectations for a rate cut in June, possibly affecting commodity prices, including WTI Crude Oil.OPEC+ and Crude Oil Stability:
WTI Crude Oil, trading around $83.48 per barrel, shows resilience due to China’s economic recovery and speculations of OPEC+ production cuts. Despite fluctuating global markets, WTI’s price is underpinned by a tight supply-demand scenario.
WTI Crude Oil’s (USOIL) outlook remains firm, trading at $83.48 per barrel, amid global economic optimism and supply-demand tightness. China’s manufacturing surge and potential OPEC+ cuts support bullish sentiments, while U.S. inflation data and Federal Reserve policy shifts could influence future price movements.
Investors should monitor upcoming economic events and market trends for signs of sustained price stability or volatility in the oil market.
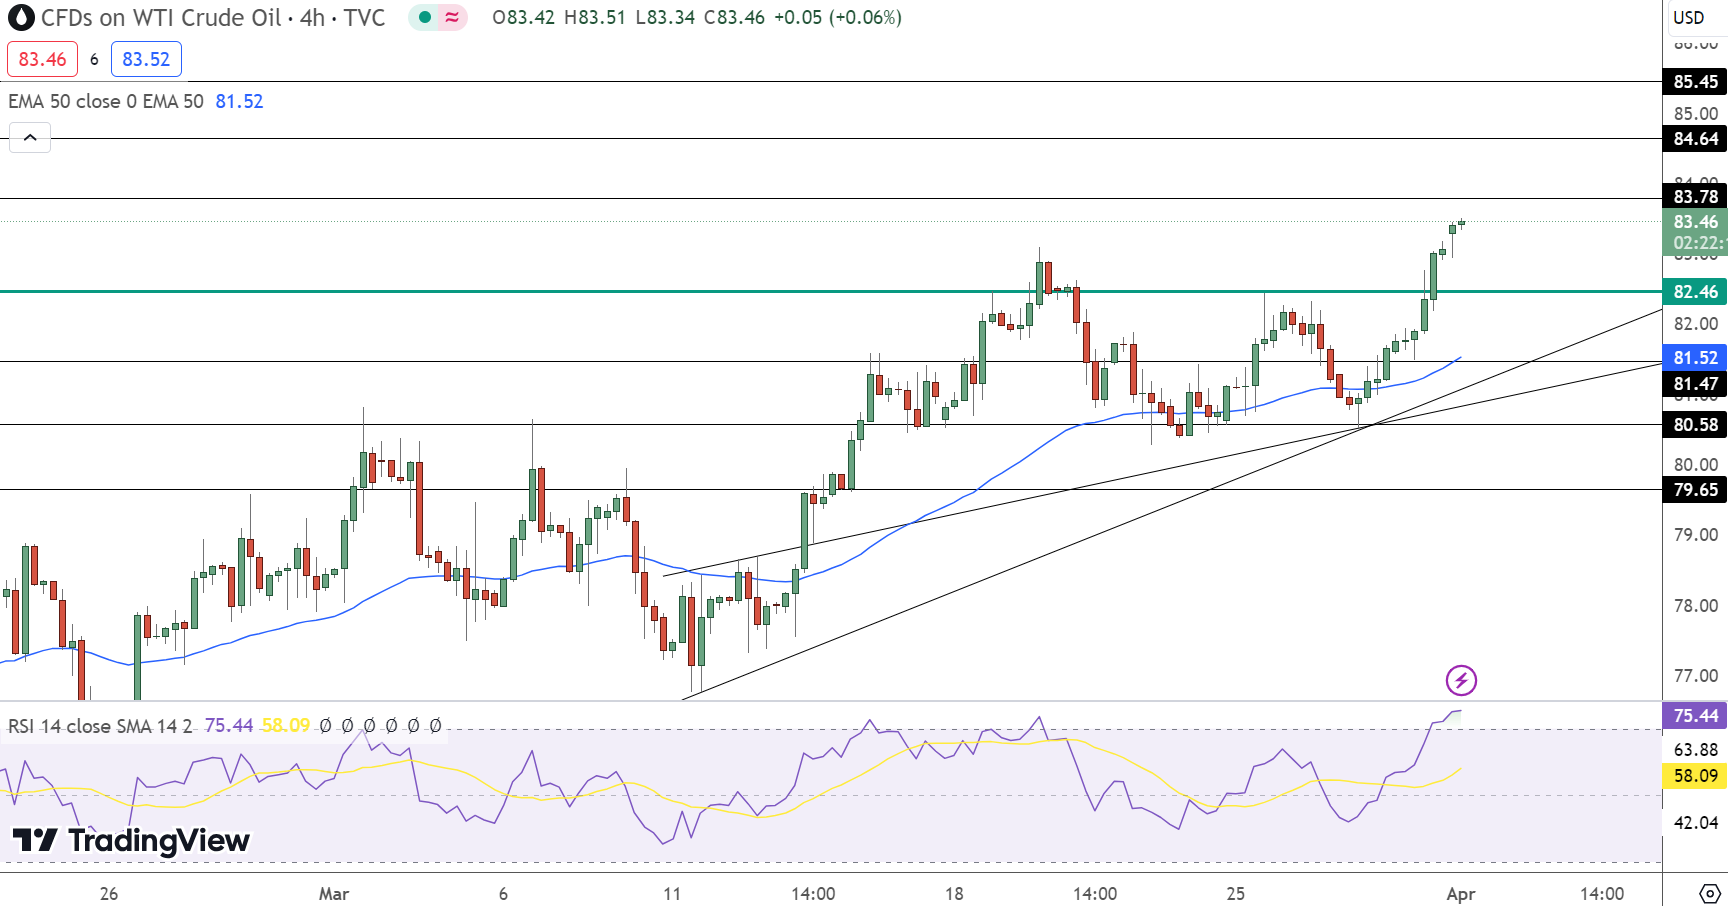
WTI Crude Oil Price Forecast: Technical Outlook
WTI Crude Oil (USOIL) marked an increase, trading at $83.46, up by 0.44%. The pivot point at $82.46 is pivotal; prices above this suggest a bullish trend. Immediate resistance levels are at $83.78, $84.64, and $85.45, which could cap upward movements.
Support is found at $81.47, $80.58, and $79.65, critical for preventing declines. The RSI at 75 indicates overbought conditions, while the 50-day EMA at $81.52 supports the buying trend.
This week, focus on US economic indicators and OPEC meetings could influence USOIL’s price trajectory. Maintaining above $82.46 could perpetuate bullish momentum, but slipping below may trigger a sell-off.


Sidebar rates
Related Posts
Add 3440

