S&P 500 (SPX) Weekly Outlook: Hits $5254 Amid Q1 Surge and Fed Rate Cut Anticipation
As we venture into the second quarter, the S&P 500 (SPX) price forecast is viewed with cautious optimism. The index ended Q1 on a high note, climbing more than 10%, the best first-quarter performance since a nearly 13.1% surge in Q1 of 2019.

Much of the gain was fueled by the ‘Magnificent Seven’, including tech giants like Nvidia and Meta Platforms. However, a recent shift has seen energy and industrials sectors catching up, signaling a broader market rally.
Fed’s Rate Decision Looms Over SPX: Investors are attentively monitoring the Federal Reserve for potential rate cuts by June. The market has dialed back expectations from six to seven cuts down to three, reflecting confidence in a ‘soft landing’ of the economy. Any economic report could pivot market expectations, injecting volatility into the SPX price.
Economic Data to Guide SPX Trajectory: The S&P 500’s path may hinge on the forthcoming economic data, including the ISM manufacturing and services PMIs and the critical non-farm payrolls report. An anticipated job growth of 198,000 in March will test market sentiment and could influence the SPX price forecast.
Earnings Season to Shape SPX Outlook: With S&P 500 earnings having grown at a 10.1% clip in Q4 of 2023, expectations are high. Yet, as companies line up to report in April, the anticipated 5.1% earnings growth in Q1 could recalibrate SPX price predictions.
The market narrative for the S&P 500 is intertwined with the unfolding economic landscape. From Fed rate decisions to pivotal earnings reports, each development will be a piece of the puzzle, painting a broader picture of the SPX forecast.
With Citigroup strategists anticipating rate cuts from June, in alignment with softer labor market data and moderating inflation, the S&P 500 stands at the cusp of potentially defining shifts that may chart its course for the remainder of the year.
S&P500 Price Forecast: Weekly Outlook
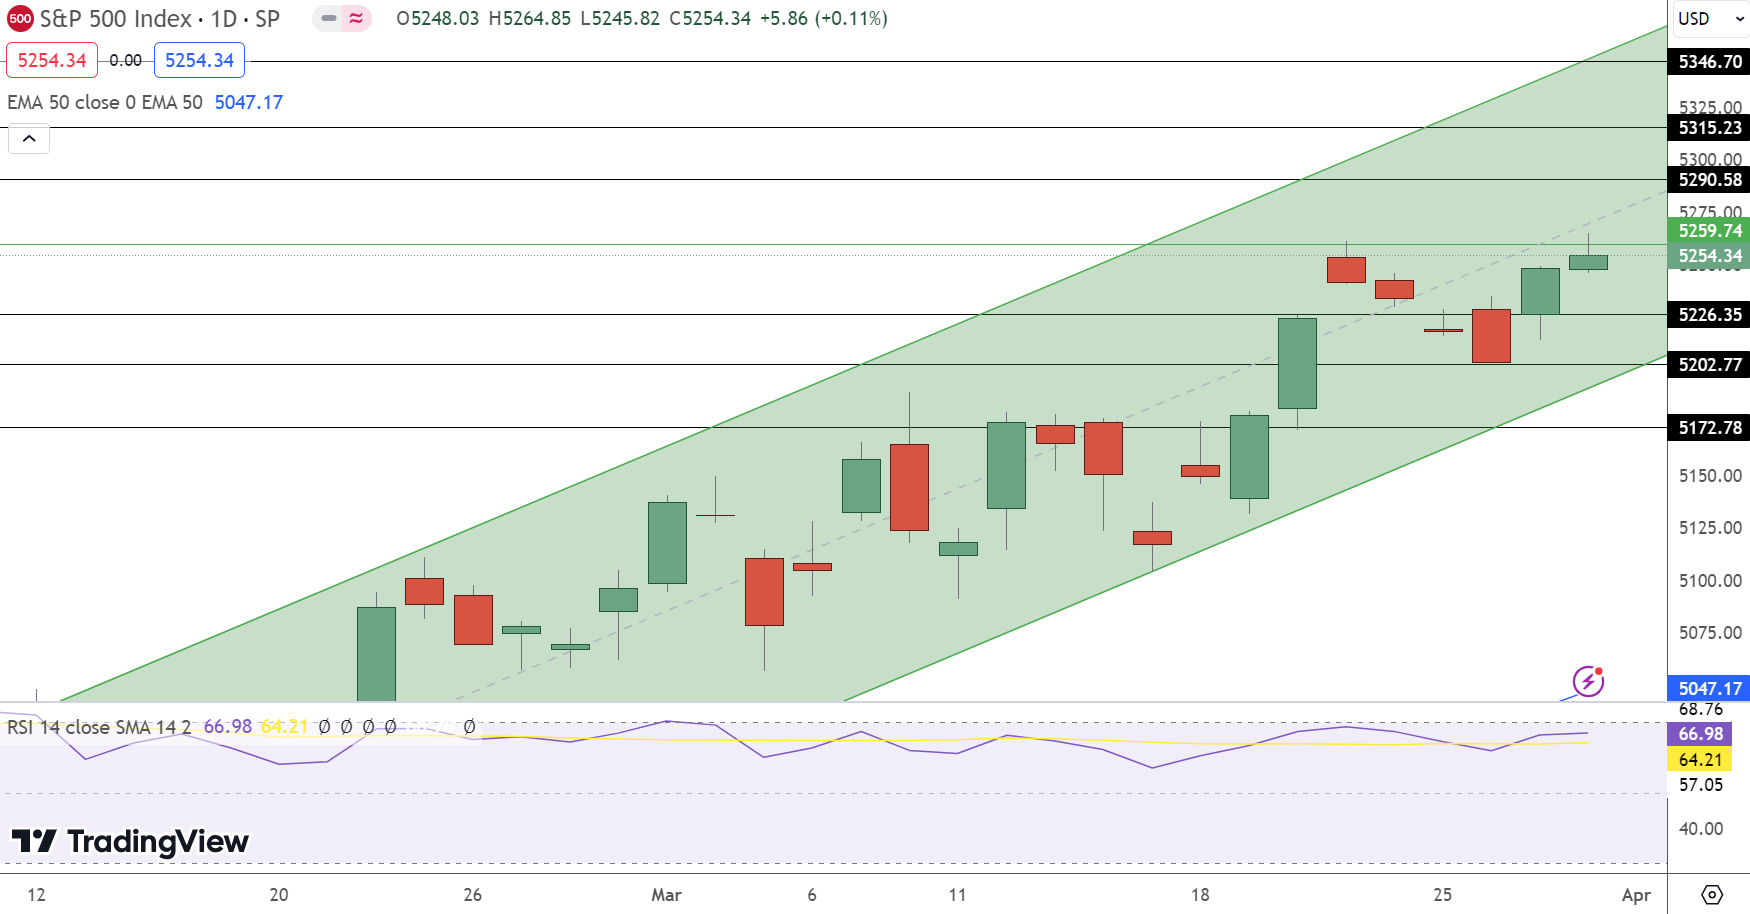
The S&P 500 (SPX) concluded the week at 5254.34, marking a modest increase of 0.40%. On the 4-hour chart, the pivot point is at 5232.00, suggesting a bullish sentiment above this level. Resistance is observed at 5281.33, 5297.10, and 5316.01, which may cap upward movements.
Conversely, support lies at 5231.74, with further levels at 5212.87 and 5198.29, providing downside protection.

Technical indicators reveal a bullish trend, with a Relative Strength Index (RSI) of 64 indicating strong momentum. The 50-day Exponential Moving Average (EMA) at 5152.02 offers underlying support. The weekly close showcased a bullish engulfing pattern, reinforcing the potential for continued upward momentum.


