Bitcoin Dips After Fed Rally, But Analysts Stay Bullish: Key Info for Traders Today
Bitcoin (BTC) is facing a pullback after yesterday's surge, currently trading above $65,000 but down over 3% in the last 24 hours.
Arslan Butt•Friday, March 22, 2024•2 min read


Bitcoin (BTC) is facing a pullback after yesterday’s surge, currently trading above $65,000 but down over 3% in the last 24 hours. This comes amidst a strengthening U.S. dollar, which tends to dampen cryptocurrency prices.
Here’s a breakdown of what traders need to know today:
- Market Correction: Bitcoin gave back some gains after a strong rally fueled by the Federal Reserve’s dovish stance on Wednesday. The broader cryptocurrency market also saw a slight decline, with altcoins like XRP, FIL, and ICP outperforming BTC in the past 24 hours.
- Dollar Strength: The U.S. dollar index (DXY) is rising, putting pressure on Bitcoin’s price. This could be due to the Swiss National Bank unexpectedly cutting interest rates, leading investors to believe other central banks might follow suit before the Fed.
- Analyst Optimism: Despite the recent dip, some analysts remain bullish on Bitcoin. Market analytics firm Swissblock believes a pullback was imminent and predicts much higher levels ahead. Investment firm Bernstein raised its year-end price target for Bitcoin to $90,000, citing strong ETF inflows and positive sentiment. Standard Chartered has become even more bullish, revising its year-end prediction to a staggering $150,000, with a potential cycle high of $250,000 in 2025.
BTC/USD Technical Analysis
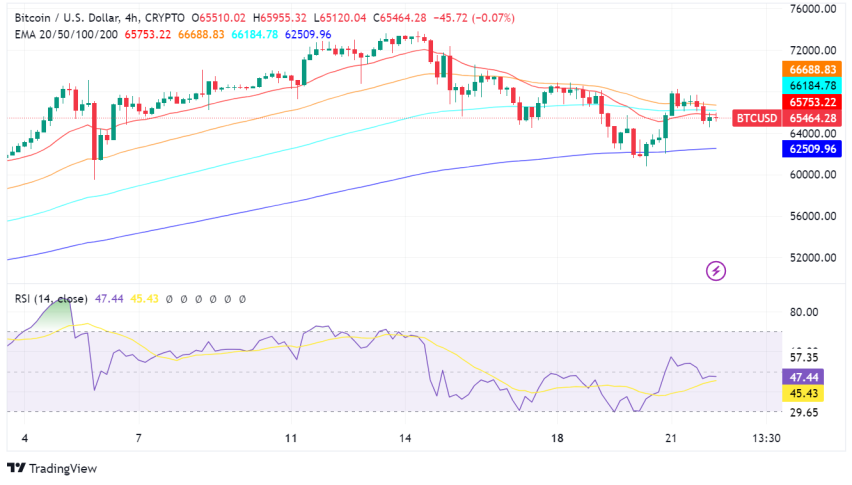
- Short-term Trend: Bitcoin is currently in a short-term downward trend after reaching a high of nearly $68,000 yesterday.
- Support Levels: The key support level to watch is around $64,600, which BTC dipped to earlier today. A break below this level could indicate further price decline.
- Resistance Levels: The immediate resistance level is around $68,000, which served as a hurdle earlier. If bulls can push past this point, it could signal a potential trend reversal.
- Moving Averages: The 50-day and 200-day moving averages are currently acting as support, indicating a possible long-term bullish trend. However, a sustained drop below these averages could suggest a shift in momentum.
- Relative Strength Index (RSI): The RSI is likely hovering around 55-60, indicating neither overbought nor oversold territory. This suggests there could be room for both upward and downward movements.
- Check out our free forex signals
- Follow the top economic events on FX Leaders economic calendar
- Trade better, discover more Forex Trading Strategies
- Open a FREE Trading Account
ABOUT THE AUTHOR
See More
Arslan Butt
Index & Commodity Analyst
Arslan Butt serves as the Lead Commodities and Indices Analyst, bringing a wealth of expertise to the field. With an MBA in Behavioral Finance and active progress towards a Ph.D., Arslan possesses a deep understanding of market dynamics.His professional journey includes a significant role as a senior analyst at a leading brokerage firm, complementing his extensive experience as a market analyst and day trader. Adept in educating others, Arslan has a commendable track record as an instructor and public speaker.His incisive analyses, particularly within the realms of cryptocurrency and forex markets, are showcased across esteemed financial publications such as ForexCrunch, InsideBitcoins, and EconomyWatch, solidifying his reputation in the financial community.
Related Articles
23 minutes ago
Save
Comments
0
0
votes
Article Rating
Subscribe
Login
Please login to comment
0 Comments
Oldest
Newest
Most Voted
Inline Feedbacks
View all comments
Sidebar rates
HFM
Related Posts
23 minutes ago


