Forex Signals Brief September 11: US Inflation and ECB Policy Meeting to Highlight the Week
Yesterday’s Market Wrap
Last week started with negative tones in the market, as Chinese Caixin services, Swiss Q2 GDP and Eurozone services PMI reports showed a further slowdown, continuing the negative trend of the previous week. But, the economic data started improving as the week progressed, with the ISM services showing an unexpected increase in August while unemployment claims came below expectations again. This lent further support to the USD, which remained bullish for most of the week.
We also saw some positive numbers from Canada, such as a jump in Ivey services PMI which made a reversal and came out of contraction in just one month. The employment report on Friday was also quite good, so we’re getting some positive signs from Canada as well as the US. However, the Bank of Canada seems to have stopped at 5.00% after holding rates unchanged again in last week’s meeting.
The Canadian Dollar experienced some demand last week, although it didn’t come from the economic data of the BOC, rather the surge in Oil prices lent support to the Loonie. Crude Oil continued its march higher last week, helped by OPEC+ members who have agreed on further production cuts.
This Week’s Market Expectations
This week starts with the eemployment report from Britain, with the unemployment rate expected to tick higher from 4.2% to 4.3%. However, the focus is more on wages numbers, with Average Earnings ex-Bonus at 7.8% and Average Earnings incl. Bonus at 8.2%. A rate hike in September is almost certain, so the report’s impact is likely to extend beyond that.
The US consumer inflation will be one of the highlight of the week and the Consumer Price Index (CPI) Year-over-Year is expected to increase from 3.2% to 3.6%, primarily due to higher Oil prices. Core CPI, which excludes food and energy, is expected to fall from 4.7% to 4.3%. This report may not significantly affect market expectations for the September FED meeting since everyone is expecting them to pause this time, but the focus is on future rate decisions.
The European Central Bank (ECB) meeting is the other highlight of the week and and odds are almost 50/50 for another rate hikes which would take the deposit rate from 3.75% to 4.00%. Economic data has been weaker recently, so they may not be too concerned about the persistence of high inflation. US weekly Jobless Claims continue to show strength, with last week’s numbers beating expectations and another soft number would help the USD further.
Forex Signals Update
Last week the USD resumed the bullish momentum afterretreating lower during the previous two weeks. We were short on the Buck initially, with a couple of forex signals carrying on from the previous week, which eventually closed in loss. But, we reversed the trade and started buying the pullbacks in the USD, which resulted in a good strategy, since the buck ended the week on a bullish note. We had 14 trading signals in total, with four losing ones and 10 winning signals.
GOLD Failed at the 100 SMA
In the previous two weeks, there has been a noticeable retracement in the price of Gold, causing it to climb above the $1,950 mark. This movement suggests that investors have been seeking refuge in Gold during uncertain times. However, the trend took a turn when yesterday’s unemployment claims data came in lower than expected, indicating a positive outlook for the labor market. This positive economic news has strengthened the US Dollar (USD), which typically exerts downward pressure on the price of Gold.
Given this shift in market dynamics, you made the decision to open a sell signal for Gold. The 50-period Simple Moving Average (SMA) on the H1 chart acted as a significant level of resistance. This indicator acted as a barrier, causing the Gold price to bounce off it, reinforcing your decision to initiate a sell position.

XAU/USD – Daily chart
- Gold Sell Signal
- Entry Price: $1,923
- Stop Loss: $1,937
- Take Profit: $1,915
USD/CAD Remains Supported by MAs
USD/CAD continues to remain on a bullish trend, as it keeps making higher highs, reaching a level of 1.3695 toward the end of the week. This upward momentum in the pair is somewhat surprising given the usual relationship between Crude oil prices and the Canadian dollar (CAD). Typically, when crude Oil prices rise, it benefits the Canadian dollar because Canada is a major exporter of Oil. However, in this case, the CAD has been weakening against the USD despite bullish Oil prices. Last Friday we saw a dip to the 50 SMA (yellow) on the H4 chart, but it held the retreat once again.

USD/CAD – 240 minute chart
Cryptocurrency Update
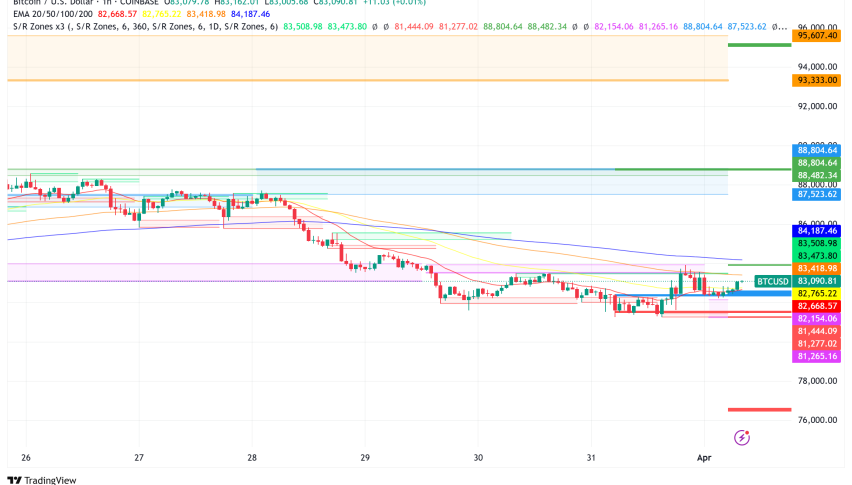
BITCOIN Remains Below $26,000
The cryptocurrency market has been experiencing a downturn since mid-July. However, there was a notable uptick in prices following a recent legal victory by Grayscale against the U.S. Securities and Exchange Commission (SEC). A D.C. court ruled that the SEC had improperly rejected Grayscale’s proposal for a Bitcoin Spot Exchange-Traded Fund (ETF). As a result, the court ordered a review of the petition and the vacating of the commission’s order.
This news had a significant impact on the price of Bitcoin (BTC), which surged $2,000 higher in response to the court’s decision. However, the rally encountered resistance at the 200-day Simple Moving Average (SMA), which seems to be a critical level for the cryptocurrency. The price subsequently reversed and fell below the $26,000 mark, where Bitcoin had been trading for several days.

BTC/USD – Daily chart
We decided to open another buy Bitcoin signal yesterday after the pullback, going in long just above the 100 MS Aon the H4 chart above.
- BTC Buy Signal
- Entry Price: $27,157.1
- Stop Loss: $25,113
- Take Profit: $29,113
MAs Keeping ETHEREUM Down
Ethereum has demonstrated a higher level of resilience compared to Bitcoin. While it was not immune to the recent crypto market crash, with the ETH/USD pair dropping below $1,600, there’s a significant observation on the weekly chart. The 200-day Simple Moving Average (SMA), represented by the purple line, acted as a support level during this turbulent period.
Considering this observed support and Ethereum’s historical behavior, a decision has been made to take a long position on Ethereum once again. This suggests confidence in the cryptocurrency’s ability to rebound and potentially perform well in the future.

ETH/USD – Daily chart
- ETH Buy Signal
- Entry Price: $1,671.79
- Stop Loss: $1,371
- Take Profit: $1,971


Sidebar rates
Related Posts
