Analysis of Gold Price Trends Amidst Market Uncertainties and Economic Data
The Gold market has witnessed notable fluctuations as it trades higher around $1,890 per troy ounce during the Asian session on Friday.
The GOLD market has witnessed notable fluctuations as it trades higher around $1,890 per troy ounce during the Asian session on Friday. This rebound follows a series of losses over the past four weeks, partly attributed to the weakening US Dollar (USD). Despite this recovery, prevailing factors such as heightened risk aversion, stronger US Treasury yields, and ongoing economic challenges in China could potentially counteract the positive impact of the USD’s retreat, influencing the overall trajectory of Gold prices.
In the face of stronger-than-expected mid-tier data from the United States (US), including a decrease in Initial Jobless Claims to 239K and an improvement in the Philadelphia Fed Manufacturing Survey for August, Gold has demonstrated resilience. This resilience indicates that investors are seeking additional insights to gauge the future stance of the US Federal Reserve (Fed) regarding monetary policy tightening. Uncertainties persist, prompting cautious investor behavior as they await more clarity before making definitive decisions.
 In the upcoming week, market participants are likely to focus on forthcoming US economic data, especially related to Home Sales and Manufacturing indicators. The imminent Jackson Hole Symposium, a significant annual event, will gather central bankers, policy experts, and academics to discuss the global economic outlook, with a particular focus on addressing ongoing inflation. This symposium serves as a platform for key financial and economic figures to share perspectives, fostering a better understanding of potential strategies in response to the current inflationary landscape.
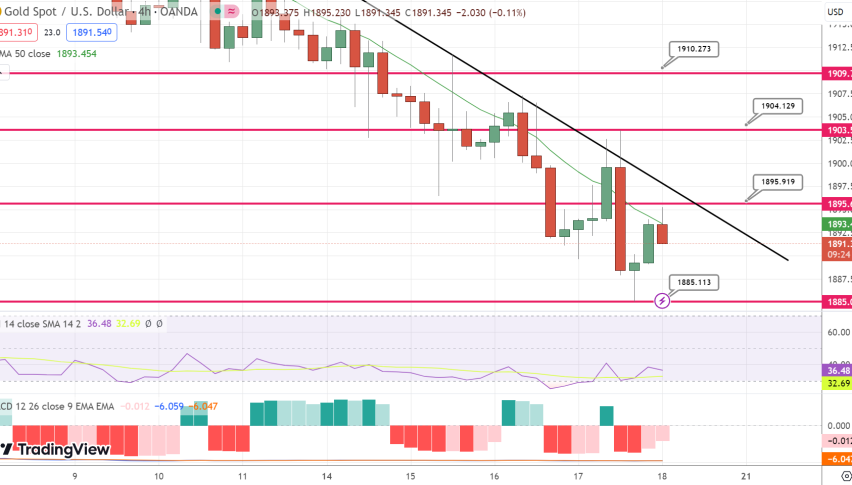
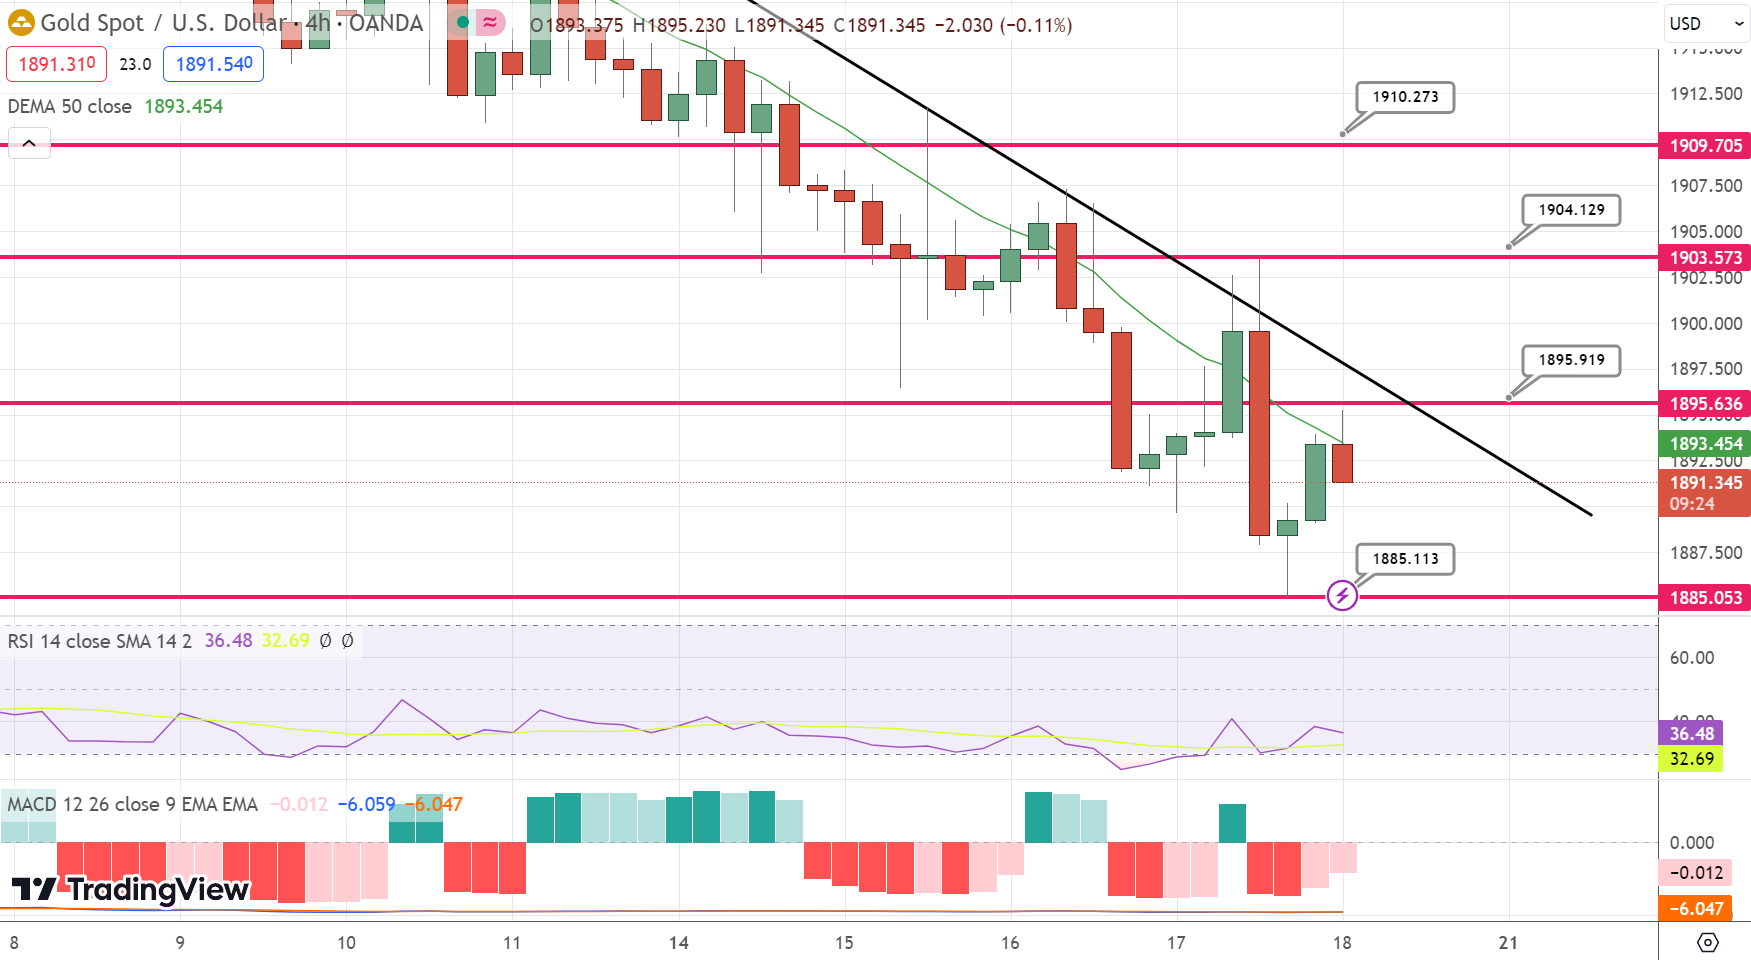
Gold Technical Analysis:
The GOLD Price has stabilized near the crucial seven-month-old horizontal support zone at approximately $1,890. This stabilization validates the breach of the 200-day moving average (DMA) to the downside, along with bearish signals from the Moving Average Convergence and Divergence (MACD) indicator.
Notably, the Relative Strength Index (RSI) line, situated at 14, indicating almost oversold conditions, lends support to the possibility of a corrective bounce in Gold prices. This suggests a temporary rebound before potentially guiding the market towards the 6.5-month-old horizontal support area around $1,860.
However, the GOLD Price’s recovery faces challenges below the 200-DMA hurdle at roughly $1,907. Subsequently, the 50-DMA and a downward-sloping trend line from early May, located near $1,937 and $1,957 respectively, are likely to test the bullish momentum before potentially leading towards July’s peak of around $1,987. This peak serves as a critical level of resistance and the final defense for Gold sellers.
In conclusion, despite the recent consolidation around key support levels, the prevailing technical indicators and broader market conditions point towards a bearish stance for the Gold Price.
- Check out our free forex signals
- Follow the top economic events on FX Leaders economic calendar
- Trade better, discover more Forex Trading Strategies
- Open a FREE Trading Account
Related Articles


Comments
Sidebar rates
Related Posts
