Oil Heads Higher for the 100 Daily SMA on Higher Demand Expectations from China
Crude Oil is heading for the 100 SMA which is keeping the trend bearish since June last year and the next test is coming up
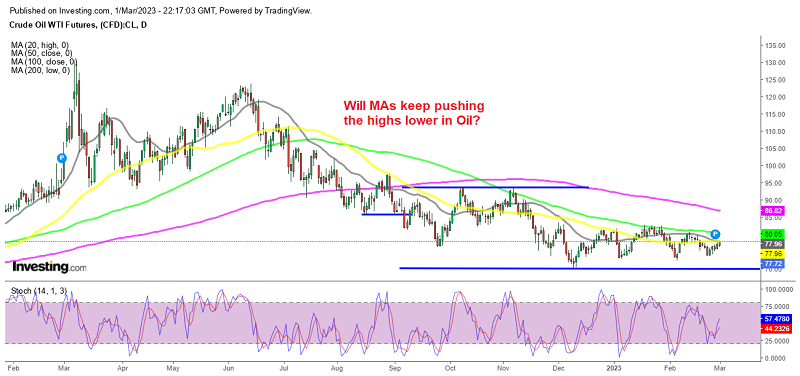
Crude Oil remains on a bearish trend overall, as the highs keep getting lower, with moving averages acting as resistance at the top on the daily chart. Although the price has formed a support zone above $70 which has been holding since December, and in the last three months crude Oil has been making higher lows, which shows that sellers are getting exhausted.
Yesterday, WTI prices experienced a slight increase despite indications of growing inventories in the US. The EIA crude inventories came below expectations with a 1.2 million barrel increase to 480.2 million barrels, against 1.7 million expected, which also played a role in the bullish momentum yesterday.
Another factor that is keeping Oil afloat as the FED prepares to continue raising interest rates, is the higher demand due to an increase in manufacturing activity in China, a top crude importer. Oil futures saw an increase of 1%, settling up 64 cents, reaching $77.69. This marks the 10th consecutive week of increasing Oil inventories, with the current level being the highest in almost two years.
Yesterday the US the US ISM manufacturing PMI report showed a slight improvement from January, but activity still remains in contraction overall (below 50), but manufacturing in China made a strong jump above the 50-point level which means that this sector is in expansionary territory. This means that the demand for Oil will increase particularly from China. The price is now at the 50 SMA (yellow) on the daily chart and if this moving average goes, then the 100 SMA (green) comes next, which is the real test.
US EIA Petroleum Inventory Data
- Crude oil inventories +1,165K vs +457K expected
- Prior week inventories were +7,648k
- Gasoline -874K vs +464K expected
- Distillates +179K vs -462K expected
- Refinery utilization -0.1% vs -0.4% expected
These numbers were a bit of a surprise and pushed Oil higher yesterday, especially after bearish private inventory data which was released on Tuesday.
US WTI Crude Oil Live Chart
- Check out our free forex signals
- Follow the top economic events on FX Leaders economic calendar
- Trade better, discover more Forex Trading Strategies
- Open a FREE Trading Account
Related Articles


Comments
Sidebar rates
Related Posts
