Meme Coins Price Analysis: Dogecoin (DOGE) and Shiba Inu (SHIB) Heading Towards Oversold Territory
Dogecoin (DOGE) and Shiba Inu (SHIB): The ever-so-popular, cultural meme coins of the cryptocurrency space have been in a painful sell-off since reaching new all-time highs in 2021.
The overall cryptocurrency market has been in a very bearish sentiment since late last year, as both large caps, Bitcoin (BTC) and Ethereum (ETH), have been dropping drastically, week by week. As of today, both mainstays have lost about 50% of their market values since November 2021. Most altcoins followed suit and have sold down even more.
DOGE and SHIB: No bottom yet
Even the crypto community’s favorite meme coins were not spared from the carnage of the market sell-off. Currently, Dogecoin (DOGE) is down by more than 80% from all-time highs of $0.74, while Shiba Inu (SHIB) is down more than 75% from all-time highs of $0.000088. Despite this, it looks like we may not have seen the bottom yet, as both meme coins are just about to enter oversold territory.
DOGE Price Analysis: Bearish Bias – Wait for Oversold Signal
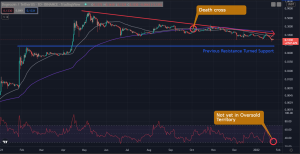
Dogecoin’s daily timeframe chart above shows a stair-stepping, down-trending price action, beginning from its all-time highs of May 2021. It has just been creating lower highs and lower lows, as it continued to go down month on month, with very few relief rallies.
Death Cross Formed
To add fuel to the fire, a bearish Death Cross formed in October 2021, to confirm that DOGE is indeed in a definite bear market. The Death Cross is a bearish technical pattern that usually signals a major sell-off in the near future.
Recovery Rally Failed
DOGE tried to rally above the long-term 200-day moving average and break the downtrend line at one point, but this rally attempt was just sold down by the bears. It even reached a high of $0.34, but the selling pressure was too much for the bulls to handle. It has fallen by 60% since then.
RSI not yet Oversold
In spite of this, a troubling technical indicator seems to be suggesting that there may be more pain coming. The Relative Strength Index (RSI) is an indicator that is usually used to measure whether a financial asset is either overbought or oversold already. What’s scary is that DOGE’s RSI has not reached oversold levels as of today.
Major Support: $0.09 – $0.10
The next major support level for DOGE is the $0.09 to $0.10 area, which was previously a major resistance. Looking back to April 2021, DOGE broke above $0.09 for the first time ever, to reach an all-time high of $0.74 a month later. This was an amazing 722% gain, if you bought the breakout. Sadly, it now seems that it is about to revisit this area again, this time as a support zone, instead of a resistance.
Wait for Oversold Signal
Watch how the price reacts when it comes near this area, as this could be a strong bounce area for DOGE. The buying demand may be higher here, as a lot of traders and investors may be looking to get in at this cheap level. Also, DOGE’s RSI is most likely to flash an oversold signal, when it falls to this area. Note that every time DOGE’s RSI has fallen below 30, its price has rallied immediately.
SHIB Price Analysis: Downward Channel, Heading Towards $0.000012 Support
Shiba Inu (SHIB) rose to popularity after Dogecoin (DOGE), as FOMO filled the cryptocurrency markets after the latter’s fantastic 700% rally within one month. SHIB did not fail to become the next DOGE, as it also rallied and made triple-digit returns in a short space of time. However, like Dogecoin, it seems to be returning towards a previous breakout point, due to the massive sell-off in the cryptocurrency market.
SHIB’s Red Flags
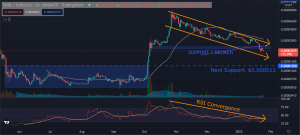
As seen in SHIB’s daily chart above, after reaching all-time highs last November, SHIB has been in a downward channel ever since losing close to 80% of its value. It has also continued to exhibit several red flags since then:
- November 2021: Price falls below the 50-day moving average (gray line) for the first time since the massive upward move
- Nov. 30, Dec. 28, Jan. 16: SHIB tried to rally three times and break out of the downward channel but failed all three times.
- Jan. 21: SHIB falls below the 200-day moving average (Purple line) and breaks a previous support area.
- RSI Convergence, Nearing Oversold: Relative Strength Index showing definite weakness and convergence with SHIB’s price. It is now nearing oversold territory and may show a relief rally soon.
SHIB Support Levels
The overall bias for SHIB is definitely bearish; however, at some point in time, it should bounce and create a relief rally. These are the possible support areas where we may see some buying demand from the market:
- $0.000017-0.00018: Lower bound of the downward channel. This has been a strong support level for SHIB, as it has already bounced from this downtrend line at least 4 times.
- $0.000012: A previous major resistance level for SHIB. It rallied above this level last October, to create a 600+% gain in a month. Now, SHIB continues its sell-off, and this could be a strong support where most traders and investors may be looking to get SHIB cheap.
Be wary when taking bounce plays, as these types of trades have a counter-trend nature. They go against the bearish macro view of SHIB and the entire cryptocurrency market. As such, you should allocate a very small portion of your portfolio to these types of trades. We recommended that you only risk 0.25% to 0.50%. Remember that this is a short-term trade of no more than 2 to 3 days. At this point, we are not picking the bottom yet – just a possible short-term relief rally.
- Check out our free forex signals
- Follow the top economic events on FX Leaders economic calendar
- Trade better, discover more Forex Trading Strategies
- Open a FREE Trading Account
Related Articles
Comments
Sidebar rates
Related Posts
