Is Fantom (FTM/USD) a Buy? Polkadot (DOT/USD) Approaches a Make-or-Break Level
FTM/USD Showing Bullish Signs
Since touching an all-time high above $3.4 on October 28, Fantom (FTM/USD) has failed to replicate the gains. It plunged to a low of about $2.4 on November 4 in a bearish market amid broader gains in the cryptocurrency market.
Nonetheless, it is easy to understand the major correction in FTM/USD. For a token that rose from a low of $1.3 at the start of October to the all-time high of $3.4 in the same month, profit-taking could be behind the latest weakness. Now, FTM/USD is showing strengths again, and buyers could jump in to take the crypto token to ATHs.
– A 4-hour Technical Outlook
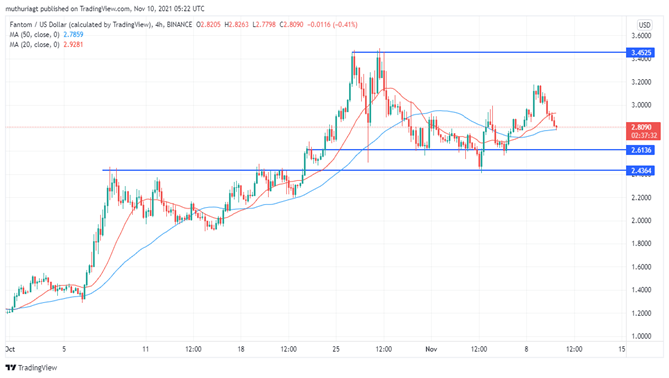
From the 4-hour chart above, FTM/USD looks to have completed the correction after its ATH and is set to go higher. The crypto-token was supported at $2.6 and has now broken to the upside in a bullish run that started on November 6. We are seeing another correction from its high of $3.15, but it remains on a clear uptrend, with the 50-moving average (blue) below it.
FTM/USD Trade Idea
I project a bullish momentum in FTM/USD as long as it continues to be supported at the $2.6 level. However, I recommend we wait for the current correction to finish before entering a buy, with the prices likely to get support at or near $2.6. Preferably, the 20 MA (red) should join the support before entering the trade.
Buy trades taken at or near $2.6 should target $3.17 and a previous ATH of $3.45. We must see a potential breakout above $3.45 to expect a further price surge on FTM/USD.
Polkadot (DOT/USD) Approaches a Make-or-Break Level
Polkadot (DOT/USD) broke from a consolidation pattern in an upward momentum on November 1 at $44. The surge was partly boosted by the anticipated launch of the parachain aimed at expanding the Polkadot’s ecosystem. However, a higher price was rejected at $54 ATH on November 3 and DOT/USD has been in a consolidation zone since then.
DOT/USD is currently facing a bearish momentum and approaching a $49.5 support area. The support of $49.5 is a make-or-break level as further drop below it could open DOT/USD to more weaknesses. Can the level hold, or could it open more weakness? At the time of writing, the DOT/USD was trading at $50.7, having dipped 3.67% in the past 24 hours and 1.62% down in the past week.
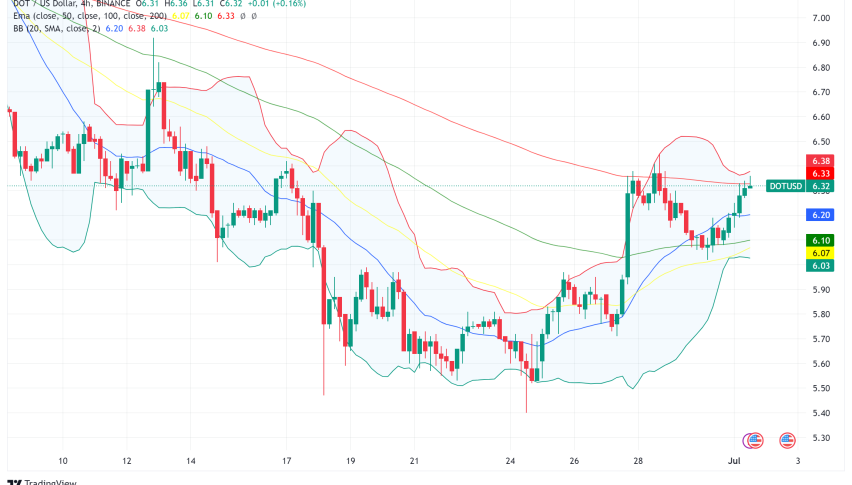
– 4 Hour Technical Outlook
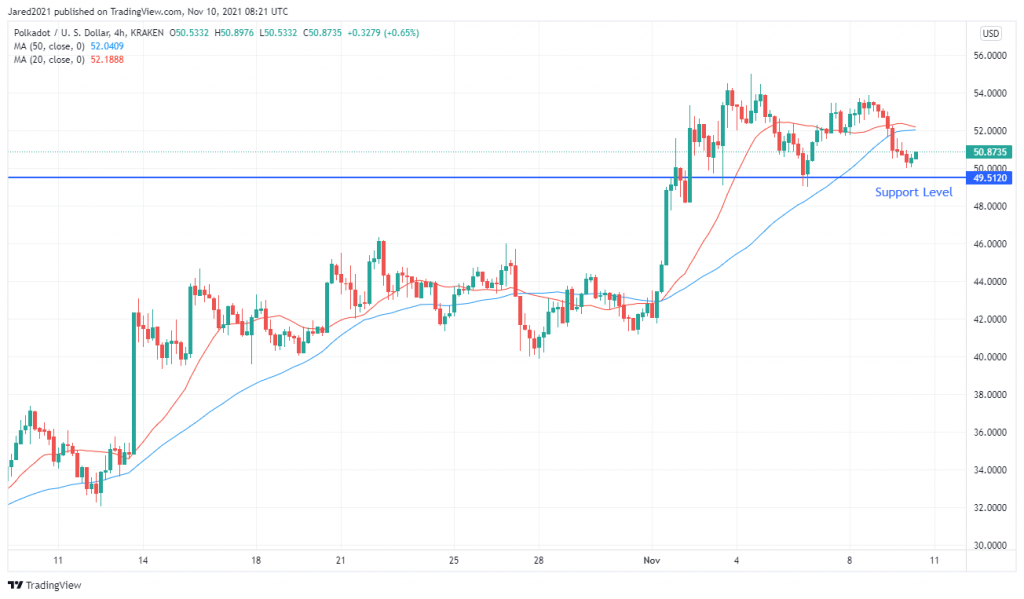
The 4-hour chart above shows DOT/USD trading below the 20-moving average (red) and the 50-moving average (blue). Nevertheless, with the pair above the $49.5 support area, we still maintain a bullish view. If the $49.5 support level holds and we see a trend reversal, $54 ATH remains a hurdle. If it does not hold, DOT/USD could fall further to $44 or $40.
DOT/USD Trade Idea
Although DOT/USD is currently facing bearish pressure, we remain bullish as long as it remains above $49.5 support. However, we can only enter a buy trade at $49.5 resistance with the confirmation of a bullish trend reversal signal. If the $49.5 level gives way, I recommend you stay on the sidelines and watch for potential signals at $44 and $40. Happy trading!
Sidebar rates
Related Posts
