Bearish Bias Dominates EUR/USD – Is it a Good Time to Short?
The EUR/USD closed at $1.2178 after placing a high of $1.2219 and a low of $1.2171. the currency pair EUR/USD reversed its course on
Arslan Butt•Thursday, June 10, 2021•3 min read

The EUR/USD closed at $1.2178, after placing a high of $1.2219, and a low of $1.2171. The currency pair EUR/USD reversed its course on Wednesday, posting gains for the day, amid the renewed risk sentiment driven by the solid Chinese economic data. Earlier in the day, a sharp decline in the US Treasury bond yields weighed on the greenback, dragging the US Dollar Index (DXY) to a daily low of 89.83. The benchmark US Treasury Yield then pulled away from the low monthly level of 1.471% set on Wednesday, and helped the greenback to stage a rebound and turn flat above 90.10% on the day .
The US dollar also suffered from the improving risk sentiment in the market, which was triggered by the continuous economic growth in the Chinese economy. The data released from China on Wednesday remained strong across the board. This buoyed the confidence in riskier assets, as the world’s second-largest economy appears to be on the road to recovery from the pandemic crisis. On the data front, at 11:00 GMT, the German Trade Balance for April came in, indicating that it was in line with the expectations of 15.9B. From the US side, at 19:00 GMT, the Final Wholesale Inventories for April were released. They also remained unchanged at 0.8%.
In the absence of any notable economic data from the Eurozone on Wednesday, the currency pair
EUR/USD performed strongly, on the back of an improving outlook for the economic recovery of the whole bloc this year. The WHO Europe and Euro Health Net have jointly signed an MOU, establishing a legal basis for teamwork on health promotion, sustainable development, health equity and investments for the health and prosperity of the people and the planet.
Furthermore, on Wednesday, the European Union lawmakers approved a new travel certificate to allow people to travel between European countries without having to quarantine or undergo extra coronavirus tests. The widely awaited certification was aimed at saving the European travel industry and prime tourist sites from another drastic vacation season. On the other hand, the US dollar remained under pressure throughout the day, but managed to place minor gains at the end of the day, amid the latest concerns about inflation. Investors believed that the upcoming CPI data would force the Federal Reserve to tap into the stimulus measures, in an effort to help the US dollar.Meanwhile, Goldman Sachs also upgraded its expectations for US inflation, stating that their economists recently pushed their short-term inflation prediction up sharply, while upholding their long-term inflation expectations. On Thursday, the European Central bank is expected to announce its policy decision. The latest announcement by the ECB, that purchases under the PEPP over the next quarter will remain higher than the purchases made during the first months of this year, reinforced the idea that the ECB will remain highly accommodating for longer. Furthermore, market participants will also keep a close watch on the US Consumer Price Index data.

EUR/USD – Daily Technical Levels
Support Resistance
1.2158 1.2191
1.2145 1.2209
1.2126 1.2223
Pivot Point: 1.2177The
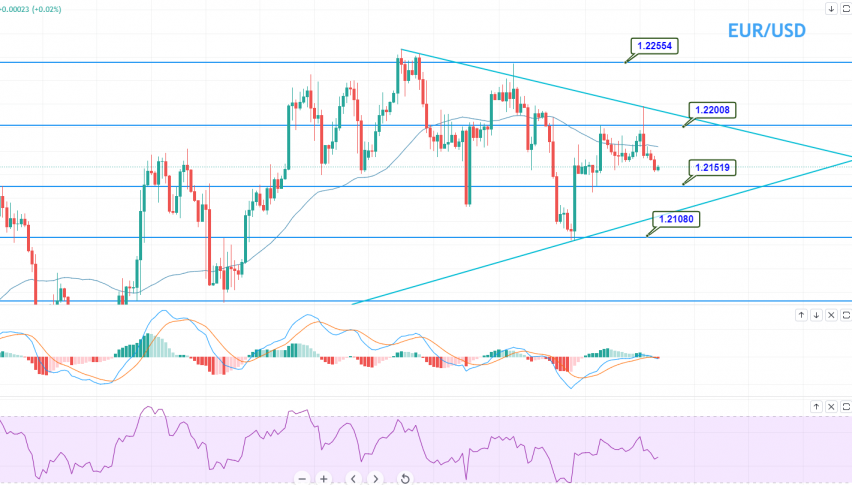
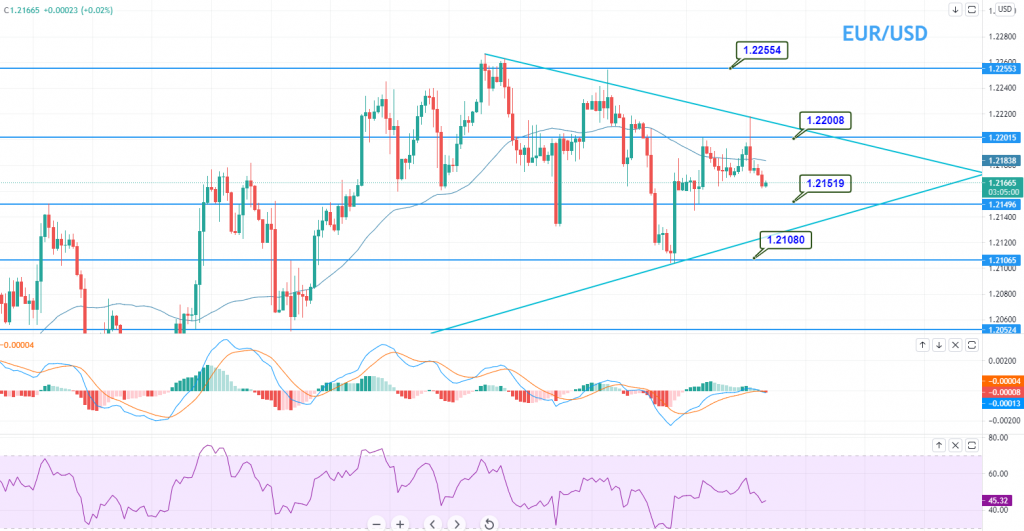
EUR/USD pair is trading at the 1.2166 level, gaining support at 1.2151. On the higher side, the
EUR/USD pair may find resistance at the 1.2200 level. The leading indicators, such as the MACD and RSI, suggest a selling bias, as the MACD is holding at -0.0009 and the RSI at 44.76. The
EUR/USD may find the next support at 1.2151 and 1.2108 on the lower side, while the resistance remains at 1.2200 and 1.2255. Let’s consider selling below the 1.2177 level today. Good luck!
Arslan Butt
Index & Commodity Analyst
Arslan Butt serves as the Lead Commodities and Indices Analyst, bringing a wealth of expertise to the field. With an MBA in Behavioral Finance and active progress towards a Ph.D., Arslan possesses a deep understanding of market dynamics.His professional journey includes a significant role as a senior analyst at a leading brokerage firm, complementing his extensive experience as a market analyst and day trader. Adept in educating others, Arslan has a commendable track record as an instructor and public speaker.His incisive analyses, particularly within the realms of cryptocurrency and forex markets, are showcased across esteemed financial publications such as ForexCrunch, InsideBitcoins, and EconomyWatch, solidifying his reputation in the financial community.
Related Articles