Polkadot Finds Support at the 20 Daily SMA – Starts to Bounce Higher
Polkadot is forming a bullish reversing signal on the daily chart
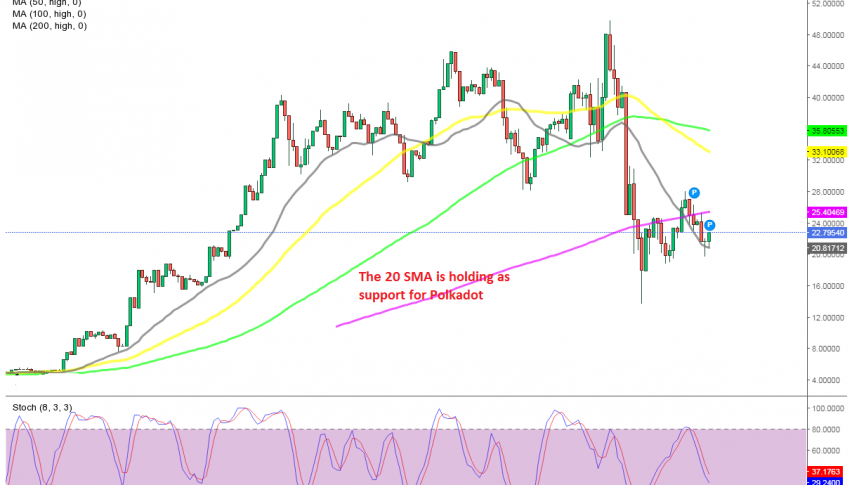
Polkadot fell for about a week until yesterday, after it had tried to turn bullish in the previous week. The bullish attempt was respectable in this crypto and it was stronger than in most other cryptocurrencies, but it ended as the bearish momentum returned in the crypto market.
That is a bullish sign, wile the other bullish sign is the fact that the lows are getting higher for Polkadot. The latest selloff was considerably smaller than in the main cryptocurrencies, and it ended yesterday, above the previous two lows.
Polkadot Live Chart
Yesterday’s candlestick closed as a pin/doji, which is a bullish reversing signal after the retreat and today’s candlestick looks bullish. The 20 SMA (gray) has slipped below the price for DOT/USD and is providing support on the daily chart. So, it looks like Polkadot is trying to reverse higher, which we hope it does, since we opened a buy Polkadot signal last night.
- Check out our free forex signals
- Follow the top economic events on FX Leaders economic calendar
- Trade better, discover more Forex Trading Strategies
- Open a FREE Trading Account
Related Articles


Comments
Sidebar rates
Related Posts
