Polkadot Price Prediction: Investors Brace to Trade a Breakout!
Lately, one of the cryptocurrencies has replaced Ripple (XRP) on the rankings; the previous several weeks and months have been exceptional..
Lately, one of the cryptocurrencies has replaced Ripple (XRP) in the rankings; the past few weeks and months have been exceptional for Polkadot, with the altcoin recording its all-time high just a few weeks ago. Nevertheless, like most altcoins, the Polkadot has also collapsed significantly amid the Bitcoin depreciation, with the crypto plunging by 17%.
However, the DOT/USD has been on an impressive uptrend since then, with the altcoin up by more than 22% in the past seven days. As per the recent stories printed by CoinShares, the crypto investment products recorded a sum of $ 395 million in inflows during last week, which is down approximately 20%, compared to $ 492 million during the third week of February 2020.
Speaking about the Polkadot, the crypto has seen $ 7 million in inflows during the previous week. Whereas the world’s second-largest cryptocurrency, Ethereum, drew almost $ 91 million during the last week of February. Thus, along with the other leading crypto pairs, we have seen significant improvement in the DOT/USD price.
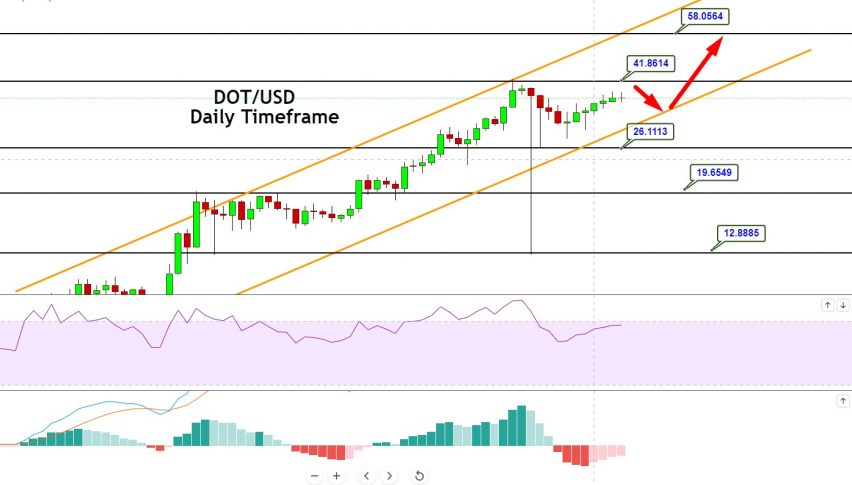
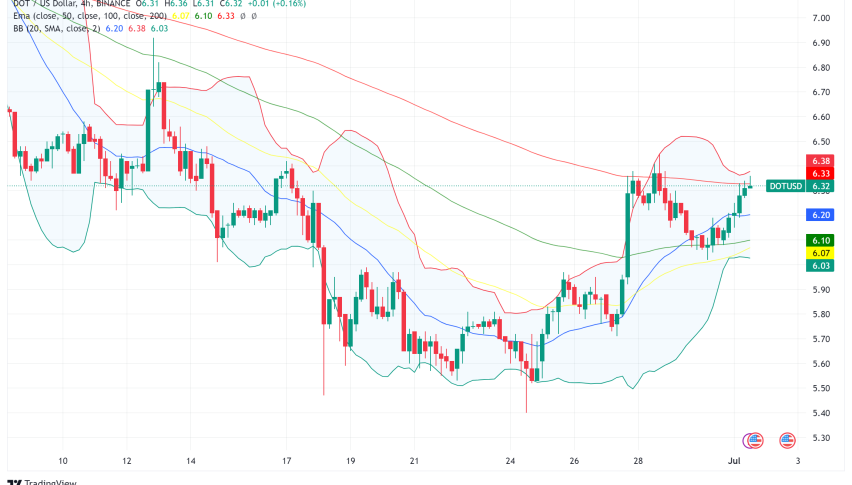
DOT/USD Price Forecast – Upward Channel to Extend Support
In terms of the technical outlook, the DOT/USD pair is trading with a neutral bias at the $ 37.22 level. On the daily timeframe, the DOT/USD has formed an upward channel, which is keeping the DOT/USD pair bullish over the $ 28.50 support level.
The Polkadot price forecast suggests a strong upward movement in the market; however, the trading volume seems a bit limited right now, as investors seem to be bracing for a proper breakout. For instance, the Polkadot is facing immediate resistance at the $ 41.55 level. A bullish crossover at 41.86 could help DOT to continue its upward flight, until the next resistance area of 58.05.
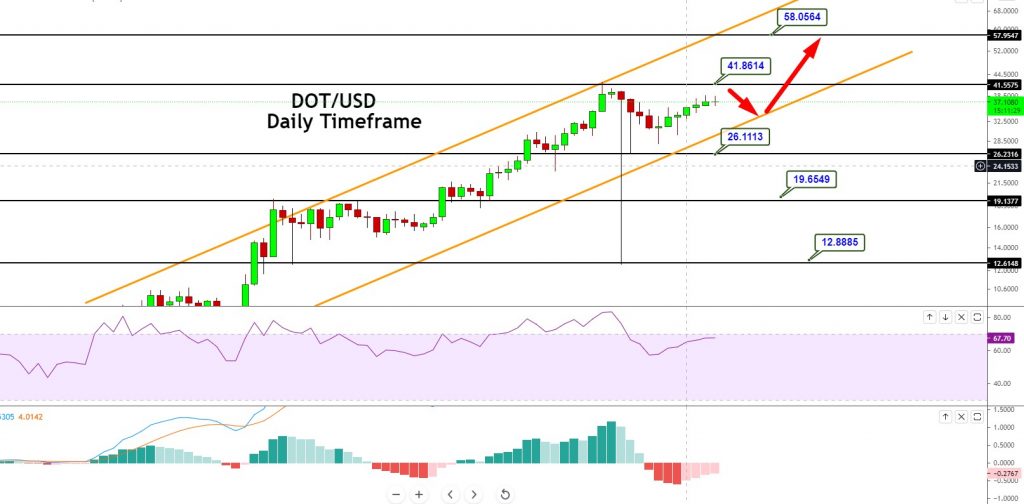
The leading technical indicators, such as the RSI and the MACD, support a neutral trend, as one suggests buying and the other supports a selling bias. The RSI is holding at 67, keeping its bullish bias, while at the same time, the MACD is holding below 0, at the -0.27 level. On the flip side, the lagging technical indicators, such as the 50 periods EMA, suggest a bullish trend in the DOT/USD pair.
For the moment, the DOT/USD is likely to find support at the $ 26.11 level, which is extended by upward channel support. The formation and closing of a series of Doji and Spinning top patterns suggests indecision among traders; thus, we don’t have a one-sided trade in the DOT/USD for now, but as soon as the DOT/USD violates the $ 41.86 resistance level, we may look for a buy signal to target the $ 58 level. I believe it’s worth trading sideways within a narrow trading range of $ 41.85 and $ 26.15, by selling below $ 41.85 and buying over $ 27, until the breakout occurs. Good luck, traders, and stay tuned to FXLeaders for more updates!
- Check out our free forex signals
- Follow the top economic events on FX Leaders economic calendar
- Trade better, discover more Forex Trading Strategies
- Open a FREE Trading Account
Related Articles
Comments
Sidebar rates
Related Posts
