Is USD/JPY Going to Reverse and Continue the Long Term Downtrend?
USD/JPY failed at the 100 SMA again last week, and has started to resume the decline
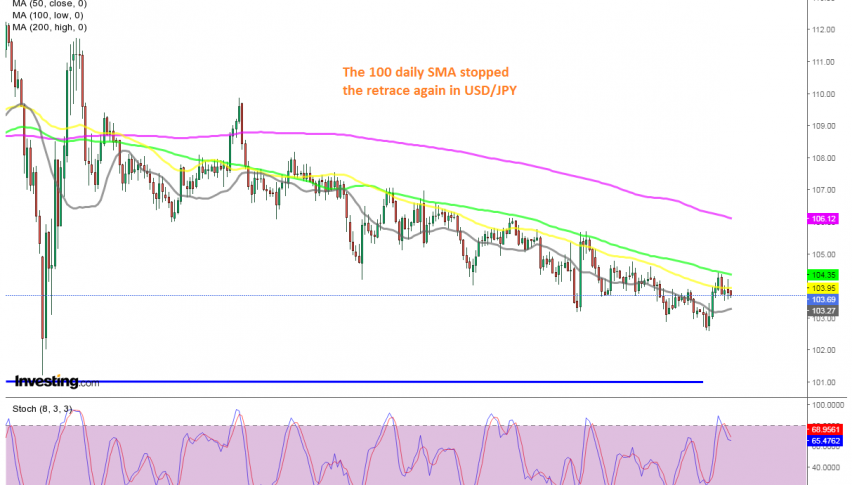
[[USD/JPY]] has been trading on a bearish trend since March, after the roller-coaster ride when the coronavirus came to Europe. The price continues to make new lows, as sellers push this pair down and in total it has lost around 11 cents from the top in March to the bottom.
Although, most of this move has come from the decline in the USD, since the USD index, the DXY has declined around 14 points during the same period and the downtrend looks quite similar. Although, during the January we have seen a retrace higher in this pair.
But, the retrace might be coming to an end soon, as the picture in the daily chart shows. During this decline, the 100 SMA (green) has been acting as the ultimate resistance, while the 50 SMA (green) has also helped. Last week USD/JPY found resistance at the 100 SMA and started to reverse lower. So, it seems like the bearish trend has started to resume again and we will probably go short at some point on this pair.
- Check out our free forex signals
- Follow the top economic events on FX Leaders economic calendar
- Trade better, discover more Forex Trading Strategies
- Open a FREE Trading Account
Related Articles


Comments
Sidebar rates
Related Posts
