The 20 SMA Is Keeping AUD/USD Bullish
The 20 SMA is pushing AUD/USD higher on the H1 chart
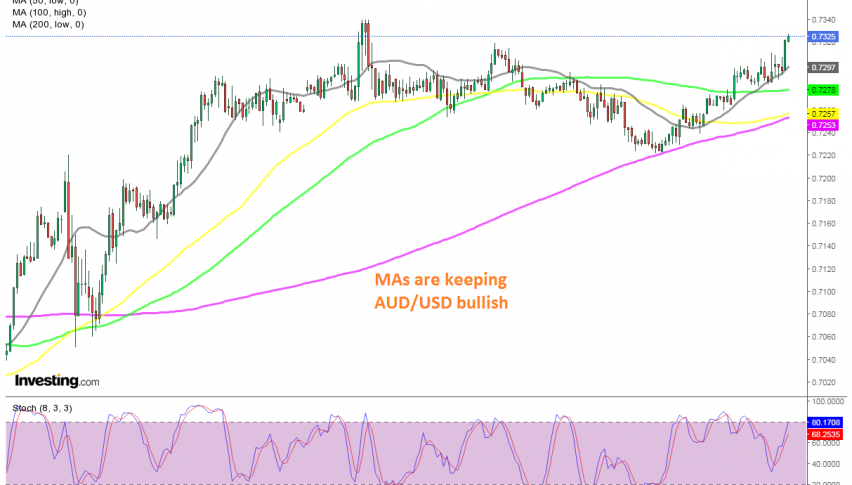
[[AUD/USD]] was one of the most bullish pairs after the decline from the coronavirus breakout in late February and early March. It climbed 19 cents from the bottom at 0.55, with MAs providing support on larger time-frames, such as the daily chart.
It broke above 0.74 on September 1, but retraced lower that month,falling to 0.70. The 100 SMA held as support and the price bounced higher, but it came back down and retested that area again and again. But the support zone held and AUD/USD and the price increased to 0.7350 last Monday.
Last Friday we saw a pullback, but the 100 SMA on the H1 chart held as support and the bullish momentum resumed again from there. On Friday, the 20 SMA (grey) turned into support for this pair and it has been pushing it higher non-stop.
My colleague Arslan opened a sell forex signal here earlier, as the 100 SMA (green) was providing resistance for several hours, but that moving average broke and the signal closed in loss. Now, we will try to buy this pair when we see a pullback down to the 20 SMA, although, we will also wait for a reversing signal down there.
- Check out our free forex signals
- Follow the top economic events on FX Leaders economic calendar
- Trade better, discover more Forex Trading Strategies
- Open a FREE Trading Account
Related Articles

Comments
Sidebar rates
Related Posts
