ETH/USD closed at 2663.30 after placing a high of 2663.30 and a low of 2532.25. Ethereum prices reached a new all-time high on Tuesday after the Berlin upgrade resulted in a drop in gas fees and a surge in DeFi activity. The growing popularity in sectors like decentralized finance (Defi) and non-fungible tokens (NFTs) has increased cryptocurrency adoption in 2021. This explosive growth that has been seen over the past few years would not have been possible without the Ethereum network. This led the ETH price to break out to a new all-time high above $2600 level after the successful launch of the Berlin upgrade on April 15.
The Berlin upgrade declined the average gas fees to a more manageable level, resulting in an increased trading volume in top decentralized exchanges like Uniswap and SushiSwap. As most top Defi and NFT products were currently operating on the Ethereum platform, the uptick in activity resulted in increased prices of ETH at a faster pace than BTC in the short term. Furthermore, Opium Network, a Defi protocol, has launched a new way for users to increase returns on Ethereum via highly leveraged exposure. Meanwhile, Binance, the world’s largest cryptocurrency exchange platform by reported trading volume, announced that it would launch a non-fungible token marketplace in June. This NFT marketplace will run on Binance Smart Chain and Ethereum Network. It means the users of the market will view Ethereum NFTs in their Binance wallet account. This news added strength to the already rising ETH prices on Tuesday.

ETH/USD Daily Technical Levels
Support Resistance
2575.94 2706.99
2488.57 2750.67
2444.89 2838.04
Pivot Point: 2619.62
The
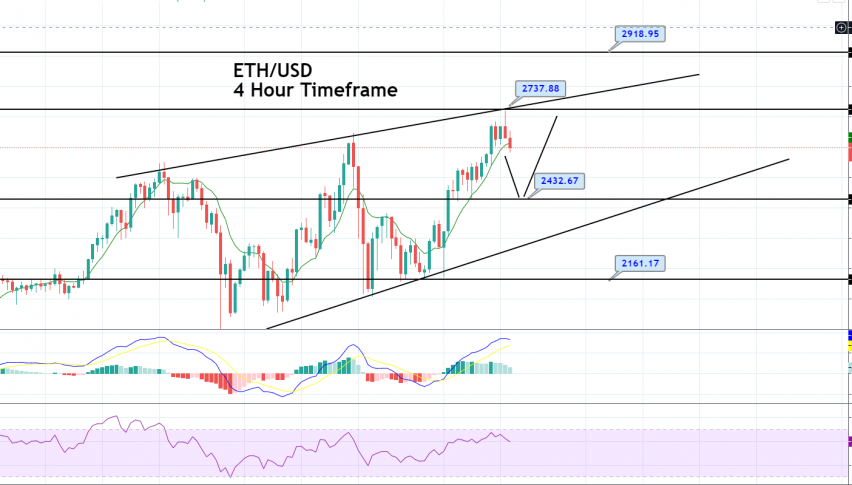
ETH/USD pair is trading at 2,613 level, take a bearish turn after being rejected at the resistance level of 2,737 level. The pair has closed tweezers top pattern on the four hourly timeframes and suggests the bearish correction below 2,737 level. On the lower side, the support holds around 2,437 levels today. The
MACD value is holding above 0 levels, but the recent histograms suggest bearish bias in the pair. At the same time, the pair is also crossing below 50 EMA on a 4-hour chart. Let’s consider taking a sell trade below 2,737 level today. Good luck!