
Brent Crude Price Forecast for H2 of 2020: Limited Upside for Crude Oil in 2020


Last Update: October 5th, 2020
Crude Oil has been a good investment, since it keeps offering many long term and short term trading opportunities. In 2008 we saw a high of $147 in both, US WTI crude and UK Brent crude Oil, which meant that the demand was at all time highs, but it didn’t last too long, as the 2008 crisis hit the markets and crude Oil crashed lower. Buyers tried to recover the losses in the following years, but since 2012 UK Brent Oil has been on a declining trend. Nonetheless, trading opportunities have been numerous in both directions. The coronavirus breakout sent US WTI crude to all time lows at -$37.50, but the UK crude Oil held above the watermark level and is now reversing back up. Although, after such a climb since the middle of March, the upside has lost momentum and further gains are in question now, as the economic rebound slows, while new coronavirus cases keep coming and the media scaremongering is dampening the sentiment in financial markets. In this article, we will take a look at possible scenarios and factors that might affect crude Oil in the coming months.
Recent Changes in the Gold Price
| Period | Change ($) | Change % |
| 30 Days | +$2.23 | +4.9% |
| 6 Months | –$14.52 | –24.2% |
| 1 Year | –$16.34 | –26.3% |
| 5 Years | –$3.64 | –7.4% |
| Since 2000 | +17.04 | +60.8% |
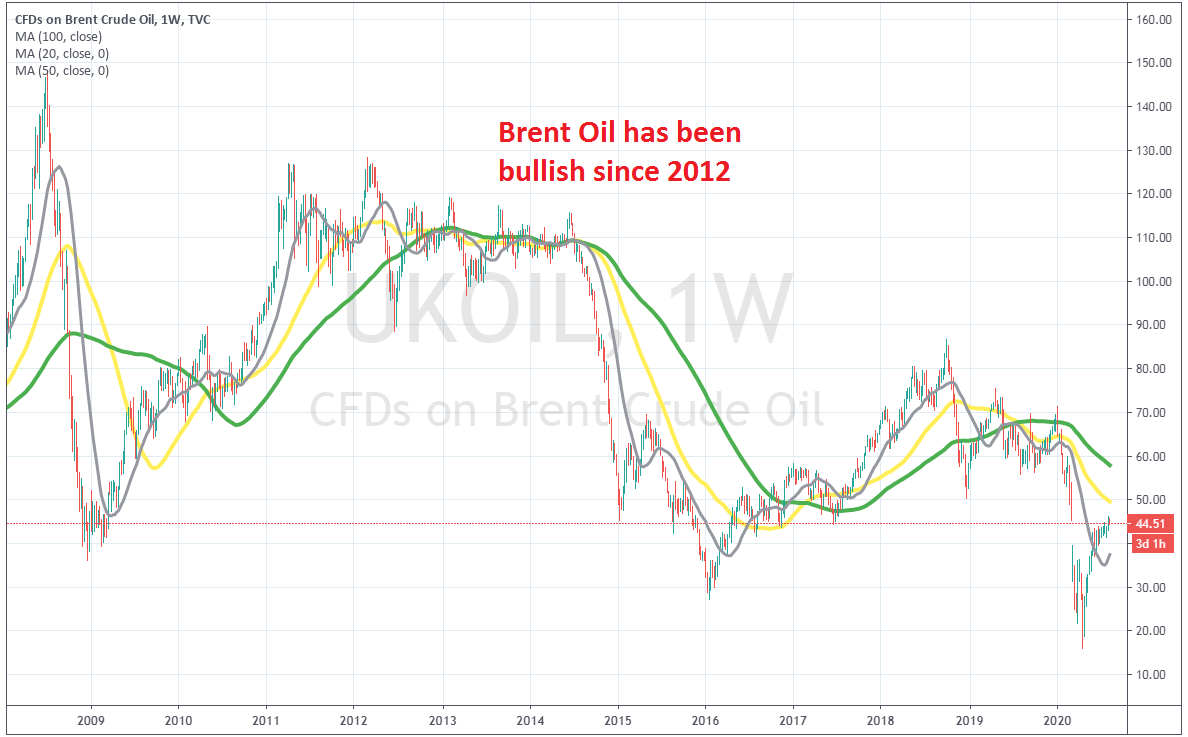
UK Brent crude Oil used to be pretty flat in the 90s, apart from 1990, when it spiked higher as the GBP crashed lower. The 2000s were very bullish for crude Oil, with both US and UK crude Oil topping at around $147, but the last decade has been bearish for crude Oil. The USD strengthening has had some impact on falling Oil prices, particularly in 2014-15, but that has been a secondary factor, so the decline in Oil prices while the global economy was recovering during the last decade, with the demand for energy in constant increase, it’s not good news for Oil in the long term. At least Brent crude survived the crash in the first three months of 2020 without falling below $0/barrel and is now climbing higher. Although, the climb also has to do with the USD weakening during this time, while gains have minimized since early June, which shows exhaustion from buyers, so the upside seems limited now, until the end of 2020.
| Brent Oil Forecast: Q4 2020 | Brent Oil Forecast: 1 Year | Brent Oil Forecast: 3 Years |
| Price: $43-$47 Price Drivers: Economic rebound, USD correlation, market sentiment | Price: $ $60-$65 Price Drivers: Post US elections, USD correlation, global economic recovery | Price: $ $50-$60 Price Drivers: Global economy, increase in demand, increase in supply |
Brent Oil Price Prediction for the Next 3 Years
When analyzing crude Oil, either Brent or WTI, we must take into account a number of factors, since Oil is the ultimate risk commodity and therefore its price action is vulnerable to many international factors. Oil is the opposite of Gold, which is the ultimate safe haven, thus both are affected by the same events, only that the price action is negatively correlated. One of those factors is the USD price, which has impacted Oil prices from 2014 until 2015, risk sentiment is also an important factor, since commodities are very vulnerable to the sentiment in financial markets, apart from supply and demand, which are decided by Oil producers like OPEC o one hand, and the global economic performance on the other. We will look into these factors in the sections below, although so far in 2020 the Oil market has been very hectic, but we hope that it smoothes down in the months ahead.
Risk Sentiment and Brent Crude Oil – Sentiment Will Remain Volatile
The sentiment in financial markets has been mostly positive during the 2010s, as the global economy was recovering from the 2008-09 financial crisis. But, the sentiment hasn’t been exactly positive for Crude Oil. UK Brent Oil recovered after the 2008 crash, but the area around $127-$128 rejected the price twice, once in 2011 and once in 2012. The highs were getting lower in the following years, which shows that the sentiment was turning negative. In 2014 Oil took a dive and despite the 2016-2018 rally, the overall trend is bearish. The trade war between the US and China was a major factor in turning Oil bearish from 2018 until this year, when Oil absolutely crashed for a number of reasons. The weakening global economy of the last two years, the coronavirus shock, the USD surge in March, the shut-downs, the global recession of Q2 this year, the Saudis flooding markets with Oil, the increased uncertainty etc have all added to the negative sentiment, but there’s some hope as the global economy has rebounded in recent months after the reopening. That said, most of the negative factors for the sentiment are still valid; the economic rebound is weakening, while the uncertainty remains high, with the coronavirus and the US elections coming in November. So, while the bounce of the recent months due to the reopening is impressive, I don’t see it being sustainable. Perhaps after the elections, the sentiment might improve further, but that still hasn’t helped Oil in during the past decade either.
Supply Vs Demand
Supply – The supply side of crude Oil is not very difficult to predict or calculate. Basically, the OPEC+ cartel decides what the production levels will be. Usually, the production is obviously adjusted to the demand, to keep prices from not falling too much, with OPEC or OPEC+ cutting the production, like the 9.7 million barrels/day that we saw in March, or increasing production. When the price of crude Oil reaches a certain level, the US shale Oil producers also increase production. That level is at around $50/barrel, which is roughly the breakeven level. The annual production has been at around 100 million barrels/day, but this year it has declined to 94.22 million barrels/day, as the demand declines.
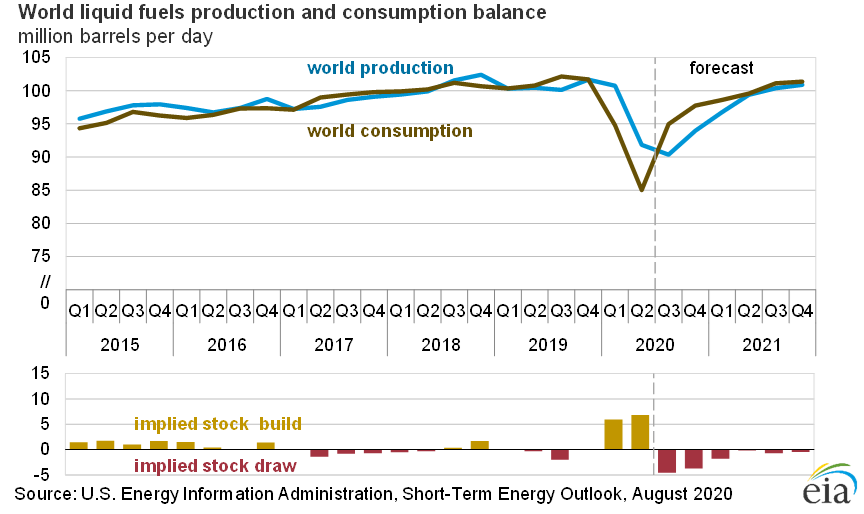
Demand – The demand is a bit more difficult to predict, since it is decided by the performance of the global economy, and to some extent the expectations for the future. As the chart above shows, the consumption, which means the demand, has been in constant increase, from around 95 million bpd to above 100 million bpd. But, this year the consumption dived due to the coronavirus lock-downs, falling to 93.14 million bpd. Although, the demand has increased as the world reopened in June, but the uncertainty remains high, so investors will hold back on investment, which means that the demand will be dampened. Besides that, air travel remains very limited. In its closely-watched monthly report, the IEA concluded that reduced air travel would cut 2020 oil demand by an annual 8.1 million barrels per day to 91.1 million barrels per day, marking a decline of 140,000 barrels per day from its previous forecast a month ago. For the coming year, the agency cut its global demand estimate by 240,000 barrels a day to 97.1 million bpd. This will help increase the price of crude Oil somewhat next year, but Ido0ubt it will run anywhere.
| Global Petroleum and Other Liquid | ||||
2018 | 2019 | 2020 | 2021 | |
| Weighted by oil consumption. Foreign currency per U.S. dollar. | ||||
| Supply & Consumption | (million barrels per day) | |||
| Non-OPEC Production | 64.06 | 65.99 | 63.61 | 65.28 |
| OPEC Production | 36.75 | 34.65 | 30.61 | 34.09 |
| OPEC Crude Oil Portion | 31.44 | 29.27 | 25.75 | 29.31 |
| Total World Production | 100.81 | 100.64 | 94.22 | 99.37 |
| OECD Commercial Inventory (end-of-year) | 2,865 | 2,893 | 2,859 | 2,757 |
| Total OPEC surplus crude oil production capacity | 1.56 | 2.52 | 5.83 | 2.87 |
| OECD Consumption | 47.82 | 47.49 | 42.71 | 45.72 |
| Non-OECD Consumption | 52.67 | 53.75 | 50.43 | 54.45 |
| Total World Consumption | 100.49 | 101.25 | 93.14 | 100.16 |
Source:EIA
XPD/USD Correlation
While sentiment and crude Oil haven’t correlated during most of the time since 2010, there were times when the correlation was strong. Now let’s see how the price of UK Brent Oil has correlated with the USD. Looking at the weekly chart for both the DXY and UK Oil, the correlation seems stronger here, but it’s obviously negative, meaning that when the USD goes up, crude Oil goes down. UK Brent Oil was trading at around $147 in 2008, but ended down to $16 by March this year. The DXY on the other hand was trading at 70 points by 2008, while it reached close to 104 points also in March 2020. So, while the climb hasn’t been as dramatic as decline in crude Oil, there has been correlation nonetheless.

Since March the correlation between Oil and the USD index has increased
The correlation wasn’t very strong during the 2008 crisis and the aftermath, with the USD reacting but not as much as crude Oil, again in the opposite direction. But the correlation grew stronger as the years went by and since 2014 the correlation has been quite strong. During 2014-15 we saw a strong increase in the USD, while Brent Oil went through a major decline, falling from $116 to $27. During this year the correlation has also been strong, especially since March, when Oil crashed lower while the USD surged higher. The situation reversed by the middle of April and the USD has been on the decline, while Brent Oil has been climbing higher, although in the last few weeks the gains have been minimal for Oil, while the decline has also stalled in the USD, which again shows correlation.
Technical Analysis – Is Silver Going to Break the 6-Year Range?
The trend has ben bearish since 2012
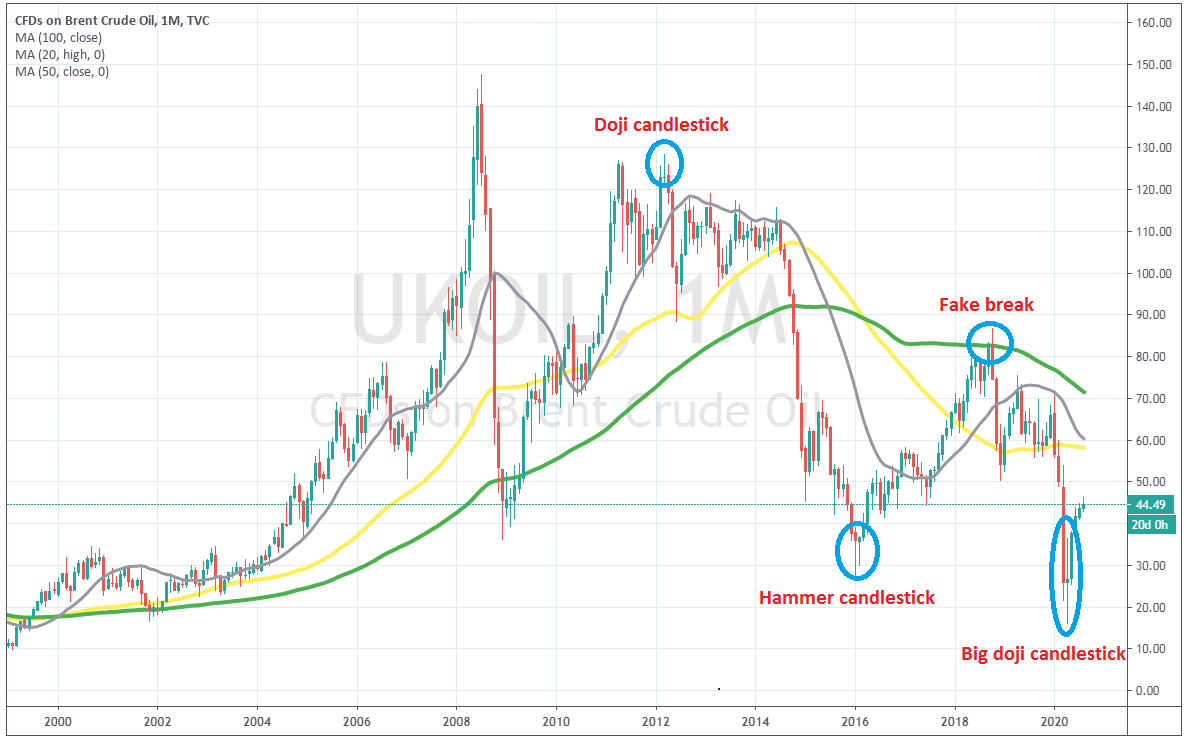
Looking at the monthly Brent Oil chart, we see that during most of the 2000s, buyers were in charge, as the price surged from around $50 in January 2007, to $147 by July that year. The 20 monthly moving average (SMA – grey) was providing support from 2014 until 2016. But, the big crash came that same year, as the financial crisis hit the financial markets hard, especially the risk assets such as crude Oil. The price recovered well in the following years, reaching $127, but after failing during the second attempt at $128 and forming a doji candlestick on the monthly time frame, which is a bearish signal, the lows started getting lower, meaning that the pressure was shifting from bullish to bearish. Then the second crash came in, starting from July 2014 and stretching until January 2016, as Brent crude fell to $27. Brent Oil made a couple of hammer candlesticks in January and February 2016, which are bullish reversing signals after a decline and the reversal higher came. That lasted until September October 2018, when the price reached the 100 SMA (green) which rejected the price. That moving average was pierced in October that year, but that didn’t count as a break according to the forex textbook, since the price returned back below it before the month ended and the monthly candlestick closed below the 100 SMA. So, the 100 SMA turned into resistance in 2018, while in 2019 and 2020 the 20 monthly SMA (grey) has taken its place, rejecting the price twice, which was followed by another crash in Q1 o this year, as coronavirus hit the world. Although, there is light after the tunnel, as crude Oil has been climbing higher, following the doji candlestick in April, which was a strong bullish reversing signal. Although, the pace of the climb has slowed down considerably in recent weeks.
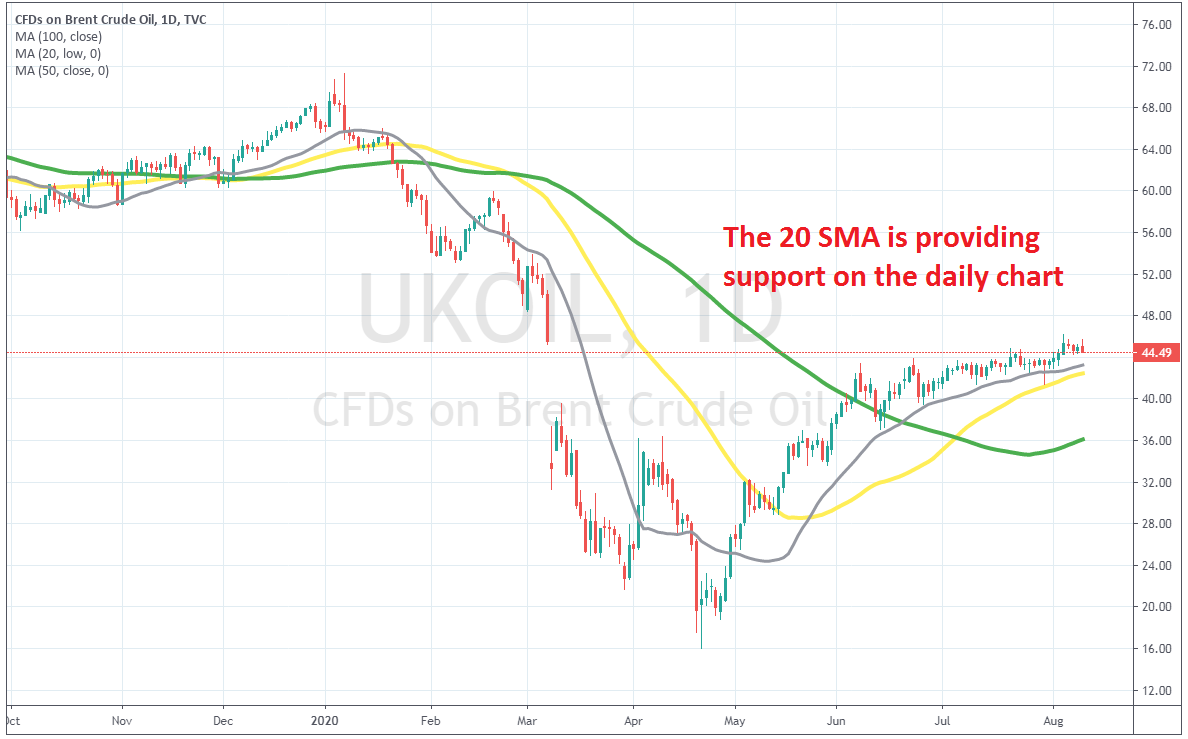
The uptrend has lost pace since June
That can be seen better on the daily chart. Here we can see that Brent Oil formed a hammer candlestick on April 22, which was followed by a bullish reversal higher, since it is a bullish reversing candlestick. UK Oil climbed from $16 in April to $44.40 in early June, which is a considerable increase, but since then the gains have been extremely hard and slow for Oil, posting only $46.20 in the first week of August. During this time, the 20 SMA has been a good indicator in supporting Oil, but I am afraid that once it gets broken, we might see a decline following.
Bottom Line
Crude Oil has been on a strong bullish trend from April until June, following the crash of the lock-down months. The sentiment improved as the world reopened and the economic indicators started jumping higher again. But, the initial optimism of May and June seems to be wearing out and the global economic rebound is not looking too strong, which is dampening the sentiment for risk assets and commodities. This can also be shown from the daily Brent Oil chart, where gains have been very minimal since early June. So, we see any further gains limited in Oil, and a further correction down, probably to $30 in the coming weeks/months, before probably turning bullish if US election and Brexit go smoothly. After all, Oil has been on a long term bearish trend, which does not change so quickly
About the author
Skerdian Meta Lead Analyst. Skerdian is a professional Forex trader and a market analyst. He has been actively engaged in market analysis for the past 11 years. Before becoming our head analyst, Skerdian served as a trader and market analyst in Saxo Bank's local branch, Aksioner. Skerdian specialized in experimenting with developing models and hands-on trading. Skerdian has a masters degree in finance and investment.


